I was thinking the other day about whether it’s always more space efficient to pack smaller apple slices in a Tupperware container compared to larger ones. If that were true, and we run into issues fitting things like apple slices in their containers, we should just adopt the habit of cutting those slices smaller.
Likewise, maybe when packing moving boxes, trying to break down objects, like side tables or ottomans or vacuums, into smaller component pieces in order to fit them into your boxes.
This had me thinking for an afternoon, until I brought up the question to my partner Kailyn who quickly surmised that this was simply integration in three dimensions! An explanation of this at the end. By then though I had day-dreamed something like a simulation-based computational method for “throwing” virtual apple slices in a virtual container and measuring how compact they get.
I thought it’d be a good learning experience to try to see this through just a bit, even if I thought I already knew the answer.
A Virtual World
To simulate throwing apple slices in a container, we need a place to do such throwing. I imagined this would be some virtual world with a physics engine. I started Googling Python physics engines, but realized it’d probably be easier to try this problem in a web browser. A web browser has much greater visual support than Python, in my opinion. A web browser also runs JavaScript, which I figured would have a ready-to-go physics engine library.
Discovering Matter.js
A quick search turned up Matter.js. I decided to keep it simpler with a two-dimensional solution. This being the first time I’ve built anything physics related, three-dimensions felt like too complicated. Matter.js looked like it’d be able to build the virtual world I needed to throw apples in.
I copied over some starter code and was able to get something running in my local web browser within minutes.
With this, I had built a very simple two boxes falling to the ground. This is already almost exactly what I envisioned!
What does one put in a container?
If we’re going to simulate apple slices, or any objects, falling into the container, we need to create those objects. To do so, I wrote the following function for building some very minimal boxes.
let box_width = 325, box_height = 70;

// create boxes and bounds
function buildBoxes(count) {
    var boxes = []
    for (let i = 0; i < count; i++) {
        let random_x = 10 + (Math.random() * 640);
        let box = Matter.Bodies.rectangle(
            random_x,
            40 * i,
            box_width,
            box_height,
            { restitution: 0.05, slop: 0.0 }
        );
        Body.setDensity(box, 0.5);
        boxes.push(box);
    }
    return(boxes)
}
var boxes = buildBoxes(7);
I first define a width and height of the “apple slices”. Obviously these don’t mimic the shape of actual cross-sectional apple slice drawings, but it’s a first approximation.
In the function, we make an array of boxes. We add a certain count of boxes, and to do so, we need an x and y coordinate to put it at. We just randomly put the box on the x-axis of the virtual world, inset a little bit from the edges. And we put each successive box increasingly further down the screen (Matter.js has a (0, 0) coordinate in the top left).
We also set a couple properties of the boxes to help them “bounce” around like “actual” apple slices. Namely, restitution, which is basically how elastic objects colliding is, and slop, which allows objects to “sink” into each other upon collision.
We also set the density of the objects so they collide and fall a bit more realistically. Finally, we push the newly created box to our array.
In the end, we create seven of these boxes, because somehow I decided that we usually cut apples into seven slices.
Now when I add these shapes to the Composite:
// add all of the bodies to the world
Composite.add(engine.world, [...boxes, ground]);
I get something that looks like the following (although random variation in the x positioning makes each run a little different):
Apples all over the counter
The previous step is more like throwing apples all over the counter, instead of in a container. It’s easy to add new bounds to our virtual world to model a container.
Simply add:
var wallL = Bodies.rectangle(0, 160, 10, 640, { isStatic: true });
var wallR = Bodies.rectangle(640, 160, 10, 640, { isStatic: true });

var bounds = [ground, wallL, wallR];
I found it difficult figuring out the numbers to use as arguments. If we were being more methodical, we might have set parameters at the top of our script to define, for example, the width of the screen to then be used in places like this.
Adding these bounds, along with the boxes, to the Composite gives us something like this:
Measuring how packed the container is
Ultimately I’m interested in measuring how packed our container gets. This way we can vary the dimensions of our apple slices (boxes) and measure the height that all that apple stacks up. I’m predicting that smaller pieces will pack more densely than larger pieces. To begin, we need to measure the height of the pieces, and then record that height.
Trigonemtry and rotated apple slices
The first solution I had was to draw a line on top of all the boxes. I wasn’t sure of the best way to do this. At first I tried to do it with Matter.js Bodies. The goal was to place a constantly flat Body on top of everything, in a way that sort of “compressed” the boxes (but actually did not interact with them at all).
I needed at the very least a y value of the top-most point of all boxes. The way I approached this was to iterate over each box on every tick of the engine’s clock, and calculate the heighest corner of each box. Then look for the highest across boxes too.
It looks like this:
let line_y = 0;

let hypo = Math.sqrt(Math.pow(box_width, 2) + Math.pow(box_height, 2));
let box_theta = Math.atan(box_height / box_width);

Events.on(runner, "tick", event => {
    let ys = boxes.map((box) => {
        let box_y = box.position.y;
        let box_rads = box.angle;

        let y_primes = [
            box_y + hypo * Math.sin(box_rads - box_theta)/2,
            box_y + hypo * Math.sin(box_rads + box_theta)/2,
            box_y + hypo * Math.sin(-1*box_rads - box_theta)/2,
            box_y + hypo * Math.sin(-1*box_rads + box_theta)/2
        ];

        let new_y = Math.min(...y_primes);

        return(new_y);
    })

    line_y = Math.min(...ys);

});
There might be a more efficient way of doing this, but for this article it works just fine and is easy to understand. To walk through it though, first off I want to establish a new variable for our line_y. This will hold the value of the top-most point of our apple slices. I also precompute two values: the hypotenuse of each box, and the angle from the mid-point of the box to the corner (\(r\)). These requires some basic trigonometry, which I always struggle with and always end up going to Kailyn and the internet for help.
Then I have an event handler attached to runner. This says, on each virtual time tick of the runner, run the following function.
In that anonymous function, I start off by creating a variable to hold our ys values. To populate this array, we iterate over each box in boxes. For each box, I store it’s current y value, or the distance from the top of the virtual environment to the mid-point of the box. I also store the angle of the box (\(\theta\)), in radians.
The most math-y part of this all is finally here. I am calculating the y-value for each of the box’s four corners. That way I can determine which one is the highest. To do this, I add the mid-point of the box’s y value to the vertical distance between that mid-point and each corner (\(h\)). This distance is dependent on the rotation of the box (\(\theta + r\)). These calculations correspond to the following illustration:
You’ll notice how we’re taking the minimum. Again, this is because the 0 of the y-axis is at the top of the screen.
Visualizing the highest point
To help debug and also as a nice visual aid, I needed a line of some sort that tracks this changing line_y computations. I tried to do this with Matter.js Bodies, but that didn’t work. I think those shapes tend to be reserved for objects that have some collision possibility. My line technically won’t collide with anything. So in that case, I found a way to draw on the HTML canvas generated by Matter.js.
I’ve had to change the dimensions of the box just a little so that the boxes fall nicely and aren’t overlapping when they’re drawn. To display a line at the top of the boxes though we need:
Events.on(render, "afterRender", (p) => {
    const ctx = render.context;

    ctx.lineWidth = 4;
    ctx.strokeStyle = "red";
    ctx.beginPath(); // Start a new path
    ctx.moveTo(0, line_y);
    ctx.lineTo(640, line_y);
    ctx.stroke();
})
Hopefully this is pretty self-explanatory. All together, we have the following:
There are two things remaining though: the repeated simulation aspect, and the recording.
Repeating the simulation ad infinitum
My goal is to compare how well small pieces fit compared to large pieces. It would be helpful if I could simulate throwing apple slices into the container many, many times to collect evidence.
To do this, I set an arbitrary threshold to determine when all the boxes have settled, and then we just redraw the canvas with new boxes. To really take advantage of the fact that this is a computer simulation, we’ll also increase the speed of the physics engine (i.e. make time go faster).
Back in our tick event listener, right after we compute the ys we’ll figure out if the line has settled:
if (tick_delay == 0) {
    if (line_y - prev_line_y < eps) {
        // the line has stopped
    }

    tick_delay = tick_max_delay;
} else {
    tick_delay -= 1;
}

prev_line_y = line_y;
// after this comes: line_y = Math.min(...ys);
Above of the tick event listener, we define the delay variables here.
let tick_max_delay = 120/engine.timing.timeScale;
let tick_delay = tick_max_delay;
let eps = 0.0001
We’ll get to it in a moment, but the engine.timing.timeScale is basically a factor determining how fast time progresses. Less than 1 is like slow motion, greater than 1 is time sped up. The 120 here is just an arbitrary number I came up with through trial and error. It basically controls how often to check if the line has settled. It’s the number of frames/ticks that pass.
Back in the logic, the code first checks if tick_delay is 0. If it is, which means it’s time to check how settled the boxes are, the code looks to see if the difference between the red line’s y-value now, compared to the last time we checked, is less than eps units. If it is, that would indicate the line has settled and we should restart the simulation. If it’s not yet time to check the line, we just decrease the tick counter until it is time.
Now, where I commented // the line has stopped we’ll fill in with:
Composite.remove(engine.world, boxes);
line_y = 0, prev_line_y = -1000;

boxes = buildBoxes(7);
Composite.add(engine.world, boxes);
This is just code I already wrote. First I remove all the existing boxes from the engine’s virtual world. We make sure not to remove the bounds. Then we reset the line’s position. Then we draw new boxes, and finally we add those new boxes into the world.
Altogether it looks like the following:
It might not be exactly perfect, or exactly fine-tuned, but it’s good enough.
Let’s do the time warp
I said we’d get back to time scale part. In Matter.js, you can control how quickly time passes with the timing option of the engine. So, for example, after we create our engine, we have:
var engine = Engine.create();
engine.timing.timeScale = 4;
This now speeds up the simulation to 4x speed! Here’s what that looks like:
Recording the height for later analysis
Just before we remove the boxes from the screen, I wanted to record the value of line_y so that we could collect some data. Remember, this is all running right in an HTML file so we don’t have any file writing capabilities. That’s okay though, for my intents I’ll just write the data to the DOM.
Above our script tags in the HTML body itself, I added a table container: <table id="data"></table>. And then in the JS, just before removing the boxes, I added:
data_counter += 1;
document.getElementById("data").innerHTML += '<tr><td>' + data_counter + '</td><td>' + (480 - Math.round(line_y*100)/100) + '</td></tr>'
Super easy to add these numbers as data, which we can just copy/paste into a spreadsheet.
Empirically packing apple slice containers
The question now is, if we simulate some number of throws of large apple slices and some number of throws of small apple slices, will the smaller pieces on average condense further in the container?
Our big apple slices are boxes with width 325 units and height 70 units, and we draw 7 of them. Thus, our small slices (let’s just say we cut the big ones in half) will be 163 units by 70 units, and we’ll draw 14 of them.
How many simulations should we run of each? First, I need to decide what will provide me with evidence that smaller slices pack better. I don’t actually know if the distribution of y values will be normally distributed. So, in that case, I’ll run two tests to empirically decide if smaller pieces fit better. I’ll run a one-sided t-test with unequal variances, and a non-parametric one-sided Mann-Whitney test.
I want to collect enough data so that I’m 90% sure that if smaller pieces actually do pack better that we’ll identify that difference. Simulations are relatively cheap; they just take time, so I can afford to increase this percentage (i.e. power) fairly high.
Second, I want to be sure not have a false positive here since I only want to do this test once. I’ll set my Type I error threshold to 0.01 (i.e. 1% of tests will be false positives).
I’m going to consider two different effect sizes before computing the required sample size to reject our null hypotheses. These include the smallest effect size I’m interested in detecting and also the expected effect size. A very wonderful resource that I leaned heavily on for this section is Daniël Lakens’ Improving Your Statistical Inferences online textbook.
Determining effect sizes and sample sizes
I figure the smallest effect size of interest here (the standardized difference between two groups) is around d=0.5. In other words, the average difference between how packed large and small boxes will get is around one-half of a standard deviation.
What I expect though is that small boxes will condense quite a bit more than large boxes. I’m going to say that the average difference of the means will be roughly a whole standard deviation.
Assuming that the data are log-normally distributed (very slightly), using a Mann-Whitney U test I figure I need about 160 observations per condition to detect a difference between these distributions.
R <- 2000
size <- 160
p <- numeric(R)
d <- numeric(R)
for (i in 1:R) {
    large <- rlnorm(size, log(400), 0.7)
    small <- rlnorm(size, log(300), 0.7)

    # t <- t.test(large, small,
    #                alternative = "g",
    #                var.equal = F)

    t <- wilcox.test(large, small, alternative = "g")

    p[i] <- t$p.value
    d[i] <- as.numeric(effectsize::r_to_d(effectsize::effectsize(t)))[1]
}
summary(d)
    Min. 1st Qu.  Median    Mean 3rd Qu.    Max.
0.09244 0.38156 0.46996 0.47423 0.56070 1.00036
As we can see, our toy data has a simulated average effect size of d=0.47, which is close enough to the smallest effect size of interest I want to capture. If the real effect size were smaller, it wouldn’t be interesting to us, and if it’s bigger we’ll catch it with this sample size.
These sample sizes with this average difference would give us 90% power too:
sum(p < 0.01) / R
0.9
About 40-45 samples per condition would be needed to detect a difference in Cohen’s d of 1.0.
With an estimated Cohen’s d of 0.5 for a t-test, the required sample size to detect a difference with 90% power is 95 observations per sample (for both large boxes and small boxes). For a Cohen’s d of 1.0, I’d need 32 observations per sample.
Unsurprisingly, the nonparametric test requires a greater sample size to detect a difference.
Let’s go simulate enough throws for have enough power to detect our smaller effect size.
Exhausting my arm with all these throws
Our simulation engine is great for throwing this many apple slices into the container. In total, I threw 320 apples (1,120 big slices, and 2,240 small slices). At $1.29 an apple (thanks TJs), that’s $412 worth of apples.
Let’s plot the distributions of y values.
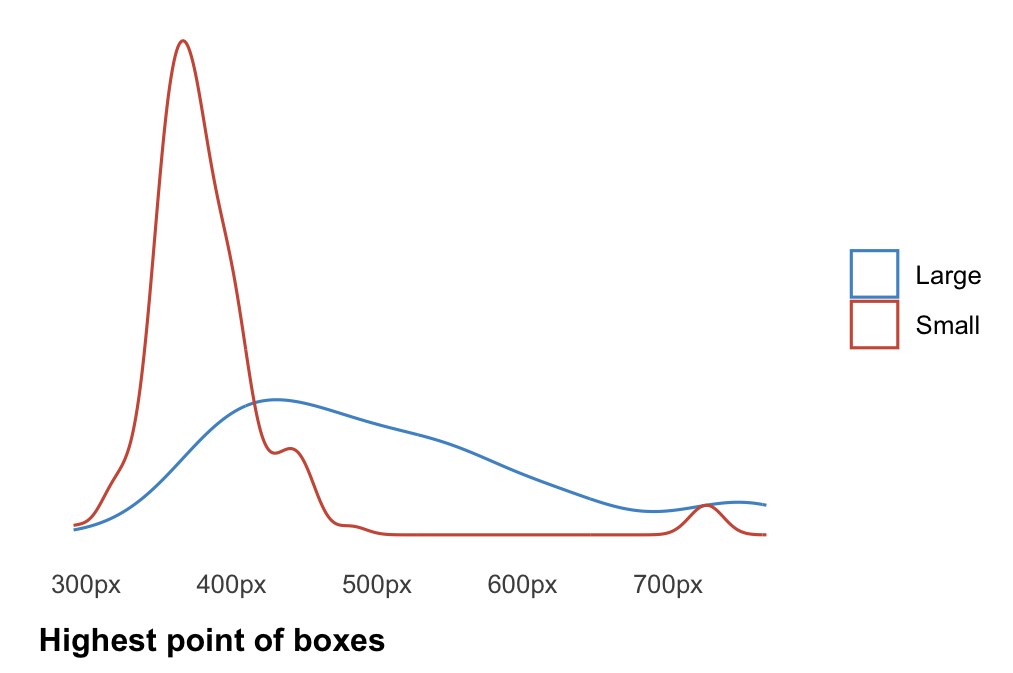
Already it looks clear that smaller boxes pack better than larger boxes, but let’s run our tests to be sure.
Do smaller objects fit better than larger ones?
wilcox.test(
    line_y ~ experiment,
    data = results,
    alternative = "g"
)
data:  line_y by experiment
W = 22785, p-value < 2.2e-16
and the stricter t-test:
t.test(
    line_y ~ experiment,
    data = results,
    alternative = "g"
)
data:  line_y by experiment
t = 12.108, df = 251.73, p-value < 2.2e-16
Hardly a contest at all. Smaller boxes packed better than larger boxes, and there’s almost no chance that this was a mistake finding.
Lastly, through induction, I’ll make the generalized claim that yes, smaller objects will on average pack better in a container than larger objects.
Isn’t this just integration?
We really didn’t need to do any of this work in order to get an answer. What we’re doing is basically approximating the surface area of our apple slices more and more accurately the smaller the slice we have. This is akin to a Reimann sum in two dimensions. For apple slices to be packed well in the container, that implies there’s no space in between slices. If there’s no space, then the question is just, how much apple is there? We’re working in two dimensions, so that can also be worded, what is the area of the apple slices?
If we knew of a function that, given some \(x\) or \(y\) value, would tell us what portion under that curve was apple, we would need to sum all of that function across our \(x\) range and again over all the \(y\) range. If that function is \(g(x, y)\) then, analytically speaking, this makes the Riemann sum equivalent to definite Riemann integration:
If \(\Delta x\) or \(\Delta y\) are large, then this is a poor approximation of the actual \(g(x, y)\) since there’s so much space between the curve and the rectangles. However they are small, perhaps infinitely small, then we get a very good approximation of the curve (i.e. a good approximation of how much surface area the apple slices are).
If we step back a moment, we’ll actually realize then that small is better, although the improvements are decreasing as we reduce the slice size. At a certain point, especially in the real world, improvements in approximating the surface area function just aren’t worth the decrease in size necessary. We can cut the apple slices smaller and smaller, and yes they will pack into the container better and better, but eventually you either A) won’t be able to cut any smaller or B) will turn your apple into pulp.