Lately I’ve been reading The Iliad of Homer. As I was reading, the idea came to me of analyzing the text of the epic, just for fun. I kept that idea in my head a bit longer to mull it over as I read, to see what things I might want to analyze.
I’ve noticed a number of quirks about the text that I thought I might be able to study in more depth. What I’ve ended up doing is really just an exploration of the book.
To start, there are some low hanging fruit in terms of quantifying what I see in the book. For example, the number of words in each of the 24 books that The Iliad is separated (by editors, not Homer himself) into.
The characters are diverse and numerous in the epic, and so I’ve been dreaming of some sort of social network analysis. The data (i.e. the text) isn’t “clean” per-se, but there are some quick things we can do to make it easier to analyze.
There’s also an interesting honorific system used in throughout the story. For example, often warriors and kings are contextualized through their father (i.e. “Achilles, son of Peleus”). This patrilineality is interesting and new to me, so I want to look into it a bit deeper.
Another quirk of the epic, which I suspect is due to the story originally being an oral tale, is the repetition of certain passages. This appears to happen when someone is relaying a message from one person to another. These messengers (sometimes actual heralds, other times kings themselves) often repeat verbatim what was told to them. There are many things to be impressed by here, and it’d be fascinating to describe this repetition numerically.
One thing which I’m not analyzing here, but might in another post, is the expression of leadership in the epic. There are many leaders throughout the tale, and I’m finding it interesting to think about how Homer portrays strong leadership.
This post is really just an exploration of the epic. It’s not unforgivingly systematic, so I’ll weave in some lessons and mistakes throughout.
Overall, I’ll start with a quick descriptive look at the most surface level anatomy of the book. I’ll explore a little data art, and slowly move deeper in the analysis to answer some of the curiosities I mention above.
Analysis Setup
The first step is to load in some packages for analyzing text. Text analysis in R feels a bit clunky and underdeveloped, so I’m loading up several packages that are pretty similar.
library(tidyverse)

# text analysis
library(quanteda)
library("quanteda.textplots")
library("quanteda.textstats")
library(tidytext)

# visualization
library(patchwork)
library(scales)
library(glue)
library(ggtext)
library(showtext)
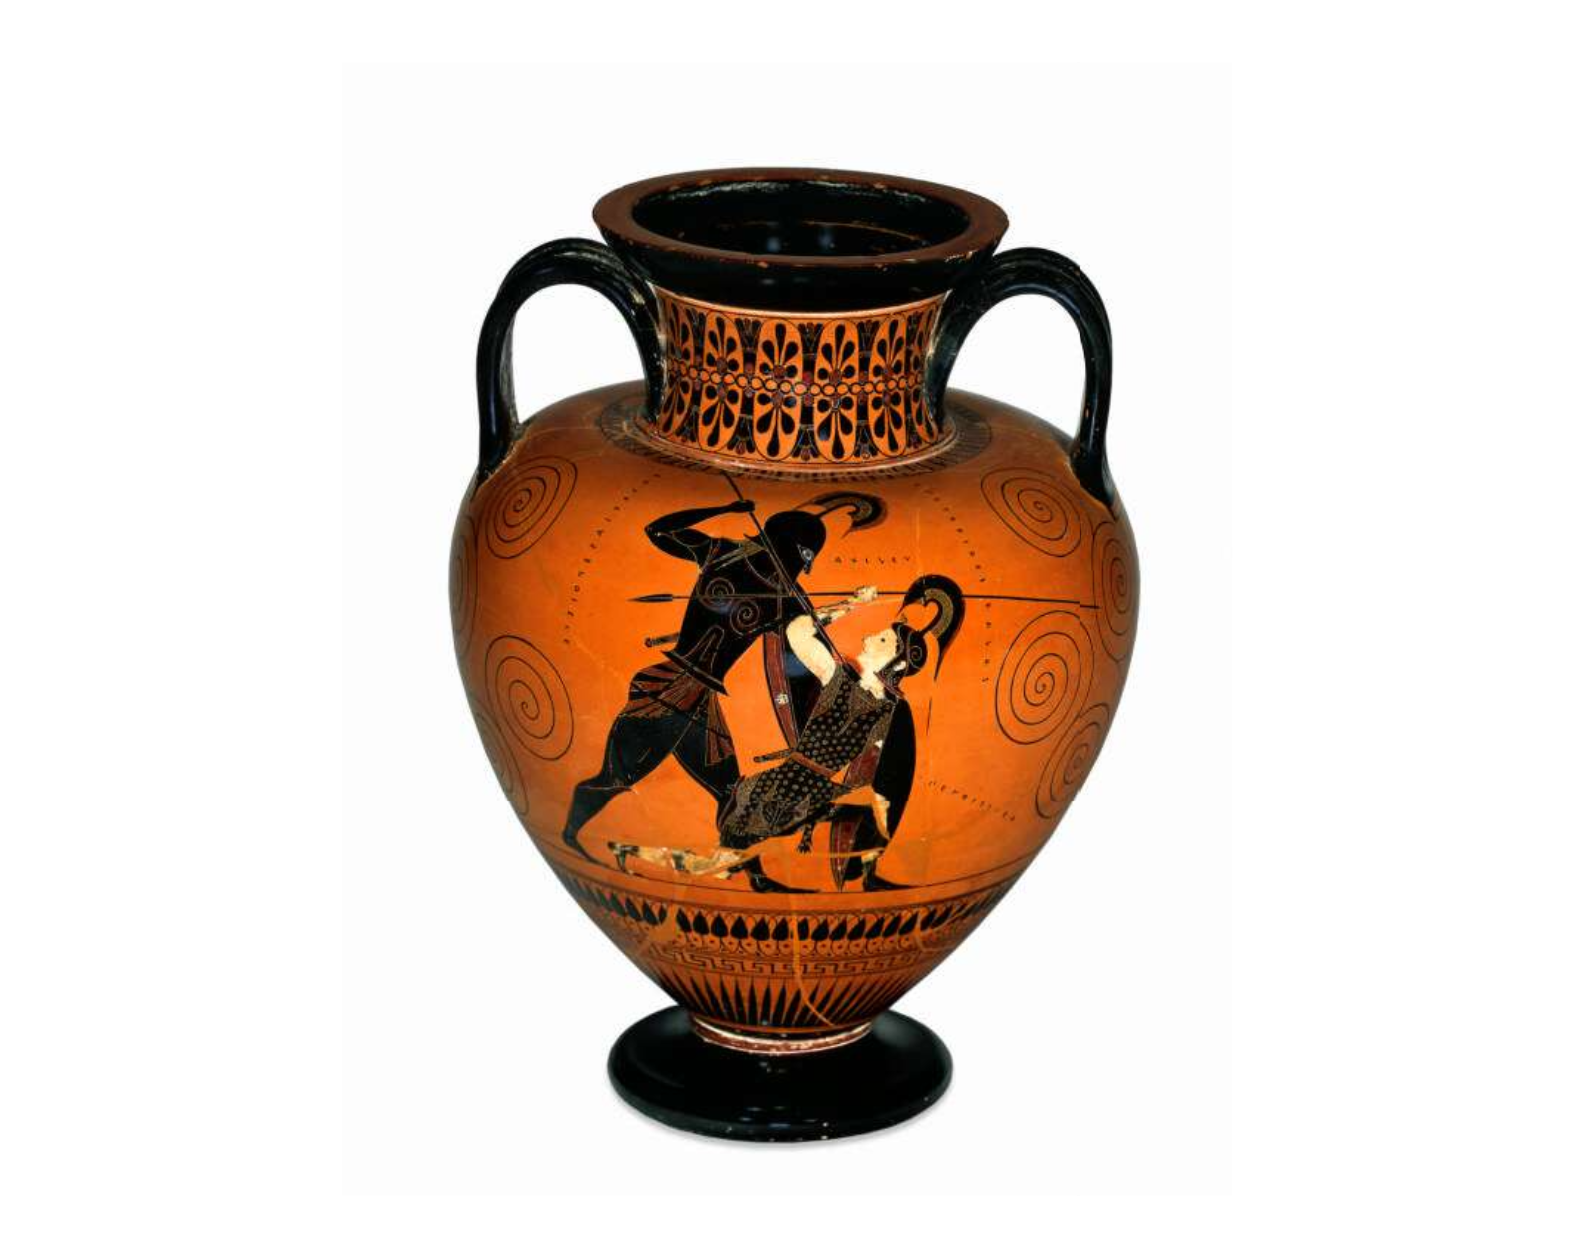
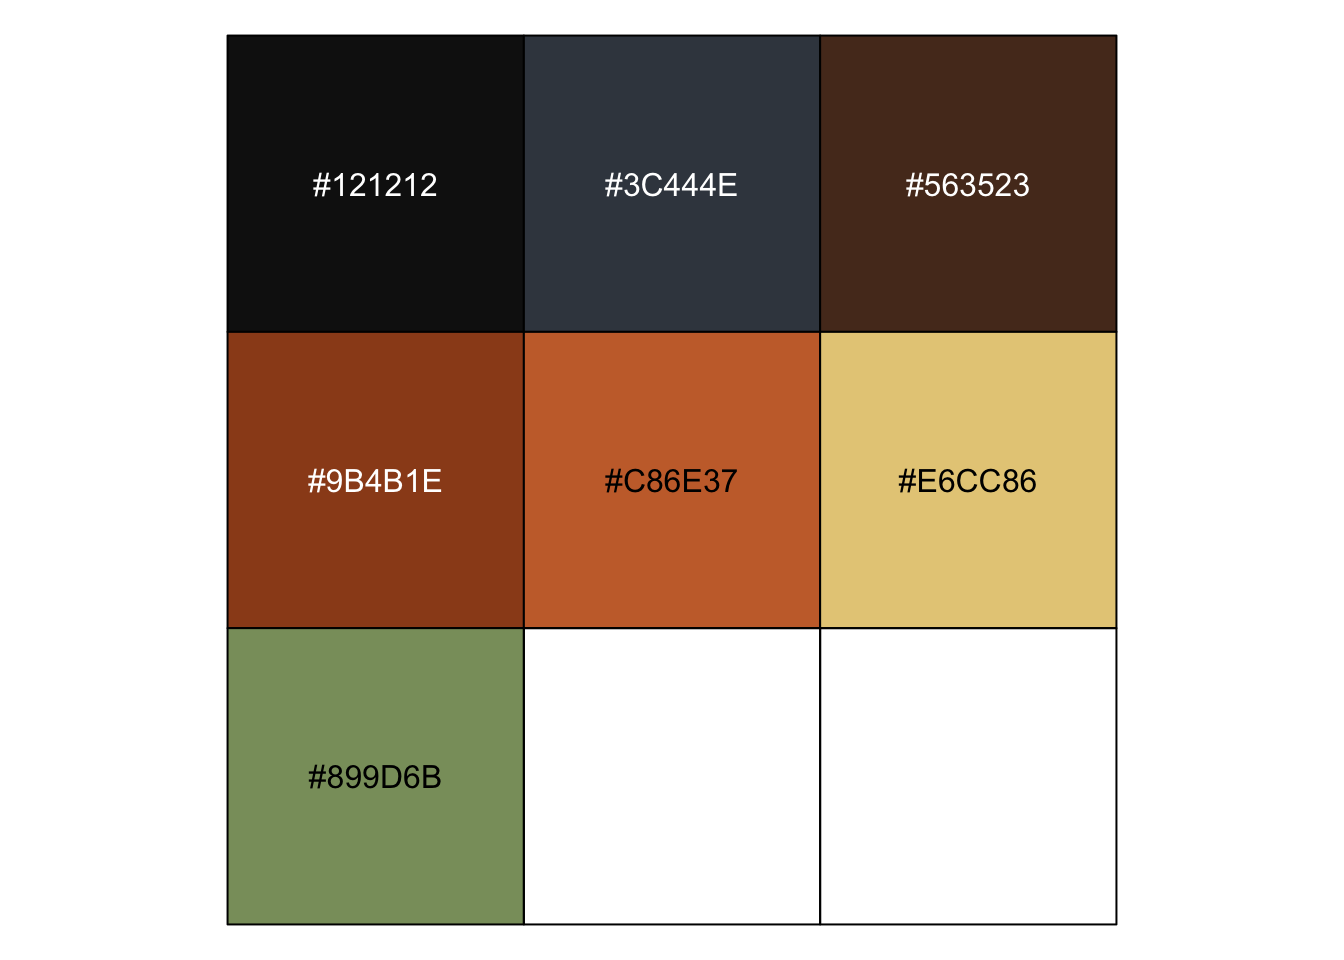
I found a few photos of ancient Grecian urns (known as amphora), and used the native Digital Color Meter on the Mac to sample some of the colors off these urns. This gives us a nice themed color palette to work with.
greek_colors <- c(
    rgb(18, 18, 18, maxColorValue = 255), # black
    rgb(60, 68, 78, maxColorValue = 255), # gray blue
    rgb(86, 53, 35, maxColorValue = 255), # dark brown
    rgb(155, 75, 30, maxColorValue = 255), # dark orange
    rgb(200, 110, 55, maxColorValue = 255), # orange
    rgb(230, 204, 134, maxColorValue = 255), # cream
    rgb(137, 157, 107, maxColorValue = 255) # green
)
show_col(greek_colors)
To bolster the style of my findings even more, I’ve found a nice serif font called Newsreader which I’d like to use in my plots. I was hoping for a serif that reflected the sharp lines of ancient Greek and Cuniform a bit better, but this works well for now. We’re using showtext here in order to pull in new fonts. I find this package is great for that, and any font restrictions I face really boil down to ggplot limitations.
font_add_google("Newsreader", "newsreader")
showtext_auto()
Lastly, I’ll pull this all into a single theme that we can add right onto plots for quick styling.
theme_iliad <- list(
    theme_light(),
    theme(
        panel.grid = element_blank(),
        panel.border = element_blank(),

        text = element_text(color = greek_colors[1], family = "newsreader"),

        axis.text = element_text(size = 10),
        title = element_text(face = "bold", size = 14),
        plot.caption = element_text(size = 8, color = "gray70", face = "plain")
    )
)
Loading The Iliad
First off, if we’re going to analyze the book we need the digitized text. Luckily, this is very easy to accomplish by heading to Project Gutenberg. My own physical copy is a Samuel Butler translation (1942) and I was able to find a digital copy as well.
Looking over the text though it’s not exactly the same as mine. I notice some minor punctuation differences mostly. The digital version uses Roman names which we revert to Greek in a second.
After downloading the text file though, I manually removed the preamble and post-script. This leaves me with primarily just the epic’s text.
Here’s a sample of what we see:
text <- read_file("butler.txt")
cat(substr(text, 1, 400), '...')
BOOK I.


      The quarrel between Agamemnon and Achilles—Achilles withdraws
      from the war, and sends his mother Thetis to ask Jove to help the
      Trojans—Scene between Jove and Juno on Olympus.

      Sing, O goddess, the anger of Achilles son of Peleus, that
      brought countless ills upon the Achaeans. Many a brave soul did
      it send hurrying down to Hades, and many a he ...
There is the famous and beautiful opening line (which has many translations) after the book summary.
As mentioned, this particular transcription of Samuel Butler’s translation uses the Roman names of some of the characters. My translation was written with the Greek names, and so I’d like to revert to those using stringr.
text <- text |>
    str_replace_all("Jove", "Zeus") |>
    str_replace_all("Saturn", "Cronus") |>
    str_replace_all("Juno", "Hera") |>
    str_replace_all("Neptune", "Poseidon") |>
    str_replace_all("Minerva", "Athene") |>
    str_replace_all("Diana", "Artemis") |>
    str_replace_all("Venus", "Aphrodite") |>
    str_replace_all("Mars", "Ares") |>
    str_replace_all("Vulcan", "Hephaestus") |>
    str_replace_all("Mercury", "Hermes") |>
    str_replace_all("Ulysses", "Odysseus")
Although Homer did not intend the epic to be split into chapters or books, this is how most modern copies are divided. This organization is helpful so we’ll split the text into its books.
books <- text |>
    str_split_1("BOOK [XIV]+\\.")

# filter out some remaining empty books
books <- books[books != ""]
Finally, each book begins with a quick book summary. We want to remove those so that the text is not polluted by them.
books_ps <- books |>
    map(\(book) {
        paragraphs <- book |>
            str_split_1("\r\n\r\n") |>
            str_squish()

        paragraphs <- paragraphs[paragraphs != ""]

        paragraphs[2:length(paragraphs)] |>
            paste0(collapse = "\n\n")
    })
We’ll make use of quanteda next and put the books into a corpus object.
book_names <- str_match_all(text, "BOOK [XIV]+")[[1]][,1]

key_text <- corpus(
    as.character(books_ps),
    docnames = book_names
)
This then gives us some nice helper functions, for example we can see how many words are in each book:
summary(key_text)
Corpus consisting of 24 documents, showing 24 documents:

       Text Types Tokens Sentences
     BOOK I  1313   6687       225
    BOOK II  1893   9121       299
   BOOK III  1066   4624       147
    BOOK IV  1300   5685       166
     BOOK V  1702   9675       295
    BOOK VI  1239   5676       164
   BOOK VII  1109   4977       142
  BOOK VIII  1335   5915       175
    BOOK IX  1449   7722       225
     BOOK X  1241   6237       197
    BOOK XI  1740   9449       237
   BOOK XII  1157   5270       125
  BOOK XIII  1708   9355       231
   BOOK XIV  1277   5840       158
    BOOK XV  1589   8245       236
   BOOK XVI  1776   9888       263
  BOOK XVII  1458   8071       211
 BOOK XVIII  1454   6723       187
   BOOK XIX  1057   4541       123
    BOOK XX  1246   5611       164
   BOOK XXI  1426   6905       206
  BOOK XXII  1288   6087       151
 BOOK XXIII  1737  10054       284
  BOOK XXIV  1545   9398       264
Scratching the Surface of the Epic
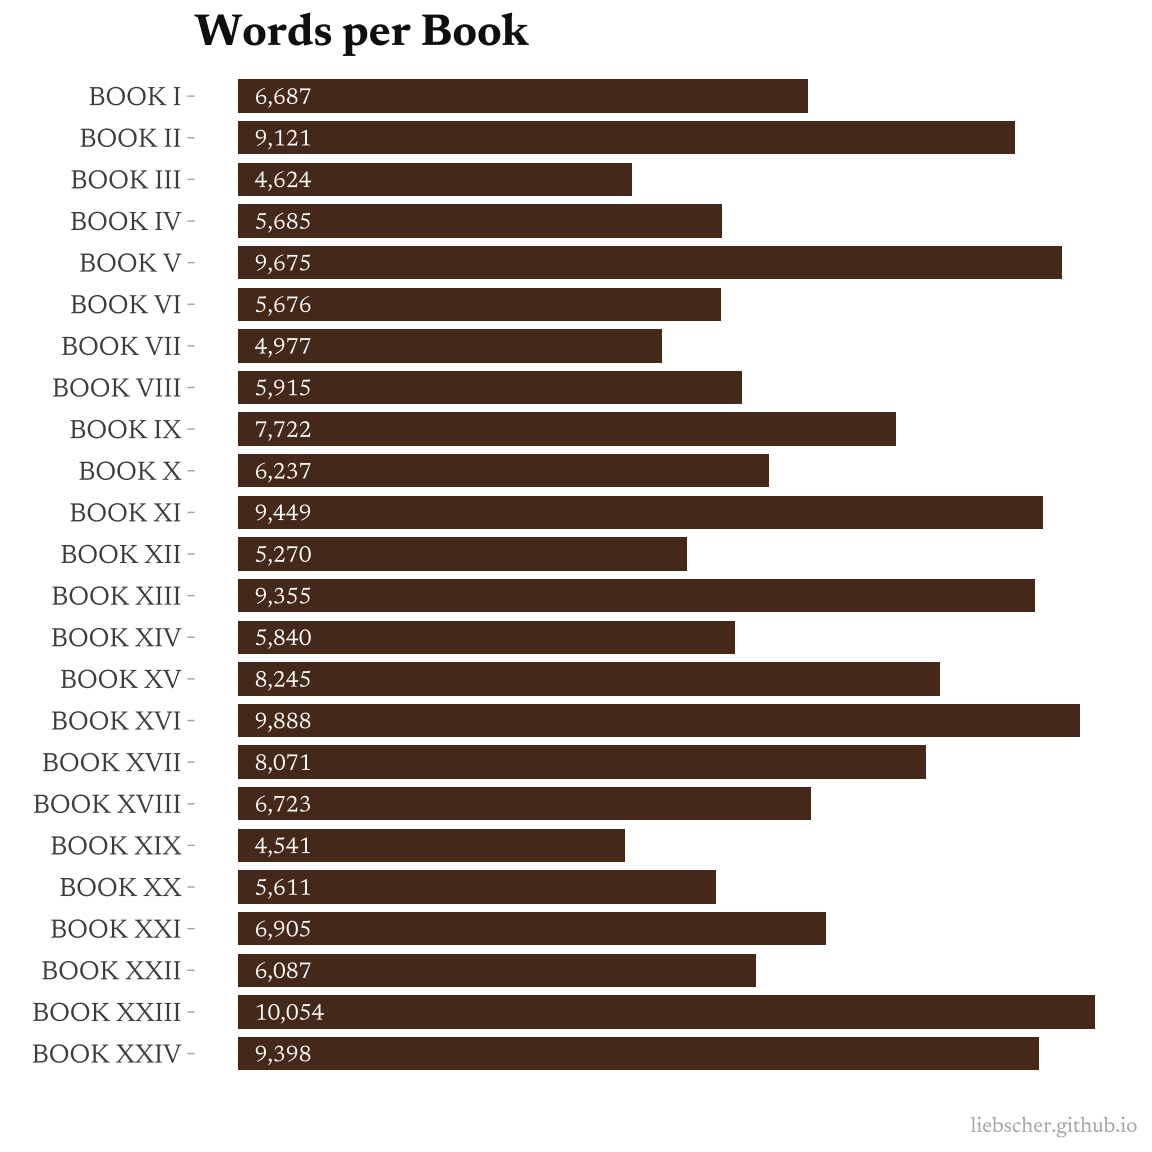
First, I want to visualize the above word count summary, to get a feel for how each book compares in terms of length:
summary(key_text) |>
    mutate(Text = factor(Text, levels = rev(book_names))) |>
    ggplot(aes(Text, Tokens)) +
    coord_flip(ylim = c(0, NA)) +
    geom_col(fill = greek_colors[3], width = 4/5) +
    geom_text(aes(label = number(Tokens, big.mark = ",")), y = 200, hjust = 0, size = 3, color = "white", family = "newsreader") +
    scale_y_continuous(labels = label_number(big.mark = ",")) +
    labs(x = element_blank(), y = element_blank(), title = "Words per Book",
        caption = "liebscher.github.io") +
    theme_iliad +
    theme(
        axis.text.x = element_blank(),
        axis.ticks.x = element_blank()
    )
Next we’ll break the books into tokens.
text_tokens <- key_text |>
    tokens()
And just out of curiosity, we’ll take a look at word frequency across all books. Before doing so we’ll remove all punctuation, numbers, and common stopwords so that our output consists primarily of “content” words, or words that will be more interesting to think about compared to “and” or “to” (i.e. stopwords).
token_freq <- text_tokens |>
    tokens(remove_punct = T, remove_numbers = T) |>
    tokens_remove(stopwords()) |>
    dfm(tolower = F) |>
    textstat_frequency(n = 30)

token_freq |>
    mutate(
        label = if_else(
            frequency == max(frequency),
            glue("{frequency} total occurances"), as.character(frequency)
        )
    ) |>
    ggplot(aes(frequency, fct_reorder(feature, frequency))) +
    coord_cartesian(xlim = c(0, 1200)) +
    geom_segment(aes(x = 0, xend = frequency), color = "gray90") +
    geom_point(color = greek_colors[3]) +
    geom_text(
        aes(label = label),
        family = "newsreader", hjust = 0, nudge_x = 20, size = 3,
        color = greek_colors[3]
    ) +
    labs(x = element_blank(), y = element_blank(),
        title = "Most Common Words in The Iliad",
        caption = "liebscher.github.io") +
    theme_iliad +
    theme(
        axis.text.x = element_blank()
    )
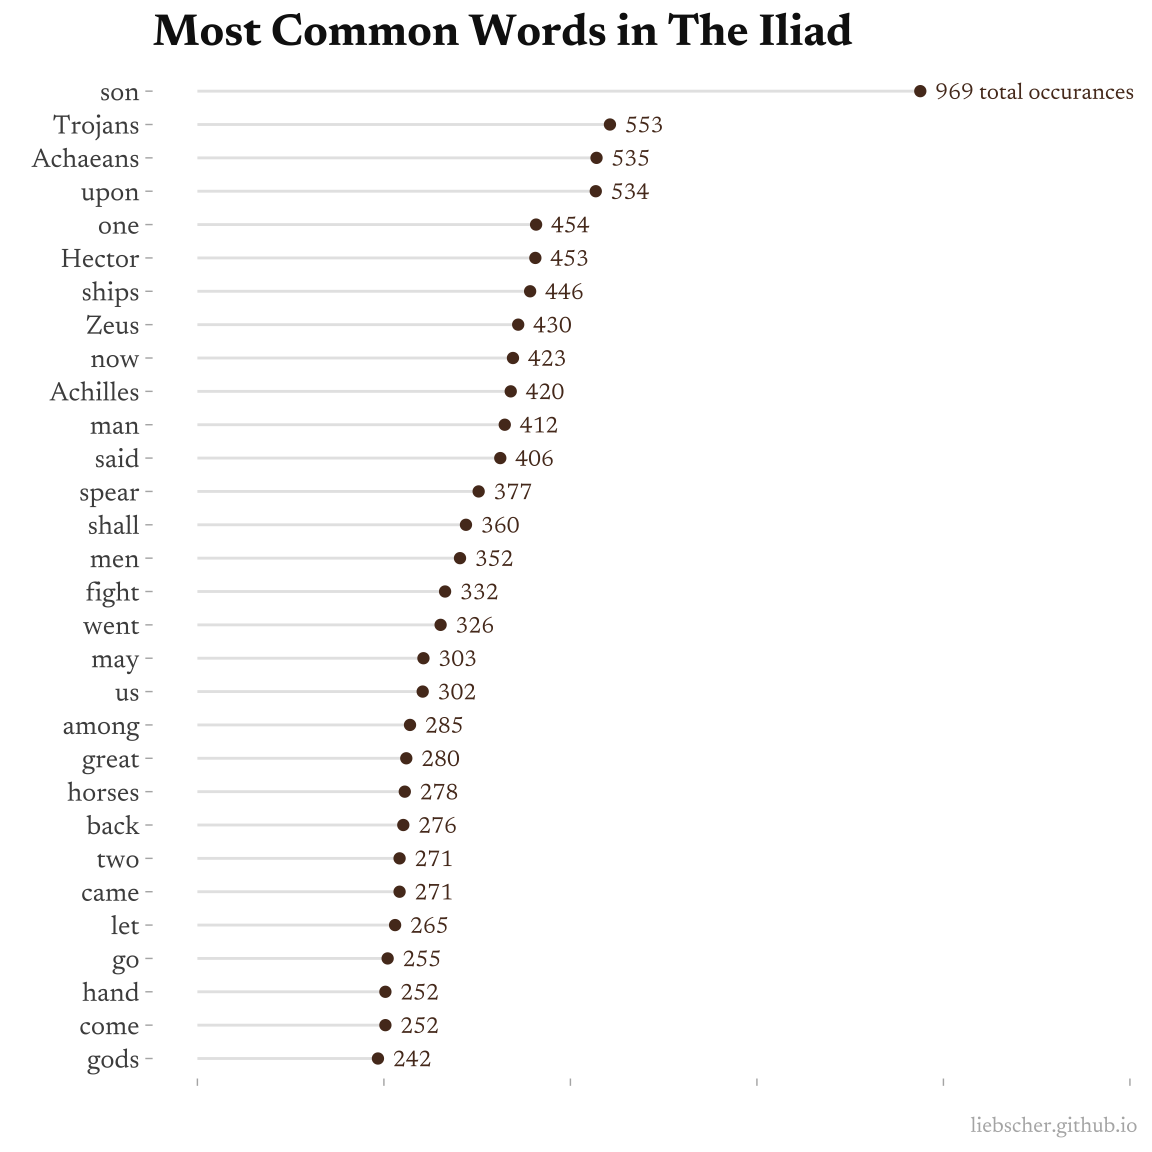
Knowing the text, these frequencies make sense. For example “son” is said often as part of the noun phrase, “son of…” some patriarch, like Zeus is “son of Cronus”. We’ll actually return to this in the last section.
It’s neat to see ships, spear, horses, and hand show up as often as they do.
Diving Below
While reading the quanteda documentation, I discovered a technique I haven’t seen before. Apparently it’s called an “x-ray” plot, based off the original visualization for Kindle. It shows the relative occurrences of a word across documents or books.
I thought it’d be interesting to look at when certain characters come in and out of the story through one of these plots. These aren’t entirely accurate plots (e.g. some characters are only mentioned in terms of their father), but they’re a first approximation.
To get started, we’ll create two helper functions. The first to create the data to plot, and the second to plot.
pull_xray <- function(token, color) {
    token_xray <- text_tokens |>
        kwic(token)

    tibble(
        token = token,
        color = color,
        docname = factor(token_xray$docname, levels = book_names),
        from = token_xray$from,
        ntokens = attr(token_xray, "ntoken")[token_xray$docname],
        relative = from / ntokens
    )
}

plot_xray <- function(xray_df) {
    xray_df |>
        mutate(docname = fct_rev(docname)) |>
        ggplot(aes(x = relative, y = docname)) +
        geom_segment(aes(
            color = color,
            xend = after_stat(x),
            yend = after_stat(y + 0.5),
            y = stage(docname, after_stat = y - 0.5)
        ),
        linewidth = 3/5) +
        scale_color_identity(
            guide = guide_legend(position = "top"),
            labels = unique(xray_df$token)
        ) +
        labs(x = element_blank(),
            y = element_blank(),
            color = element_blank(),
            caption = "liebscher.github.io") +
        theme_iliad +
        theme(
            axis.ticks.y = element_blank(),
            axis.text.x = element_blank(),
            legend.text = element_text(size = 14)
        )
}
While writing this code, I actually started with the data art aspect (covered in the next section). I’ll start with the simpler version first, but while exploring these solutions I ran into an unexpected headache. Two problems arose: I wanted the x-ray bars to show up on a normal discrete y-axis, and I wanted the x-ray bars to be centered on each discrete tick.
The solution was to modify the plot layers for y and yend with after_stat and stage. The problem was that the discrete axis was being converted to a numeric axis under the hood, and in order to shift the segments vertically I needed to modify this conversion function.
Early on in The Iliad we say goodbye to Achilles for a while. He returns a bit in the middle and at the end, but he has a distinct ebb and flow of appearances in The Iliad.
Let’s compare how often he is mentioned to how often Zeus, who is present throughout, is mentioned:
bind_rows(
    pull_xray("Achilles", greek_colors[1]),
    pull_xray("Zeus", greek_colors[4])
) |>
    plot_xray()
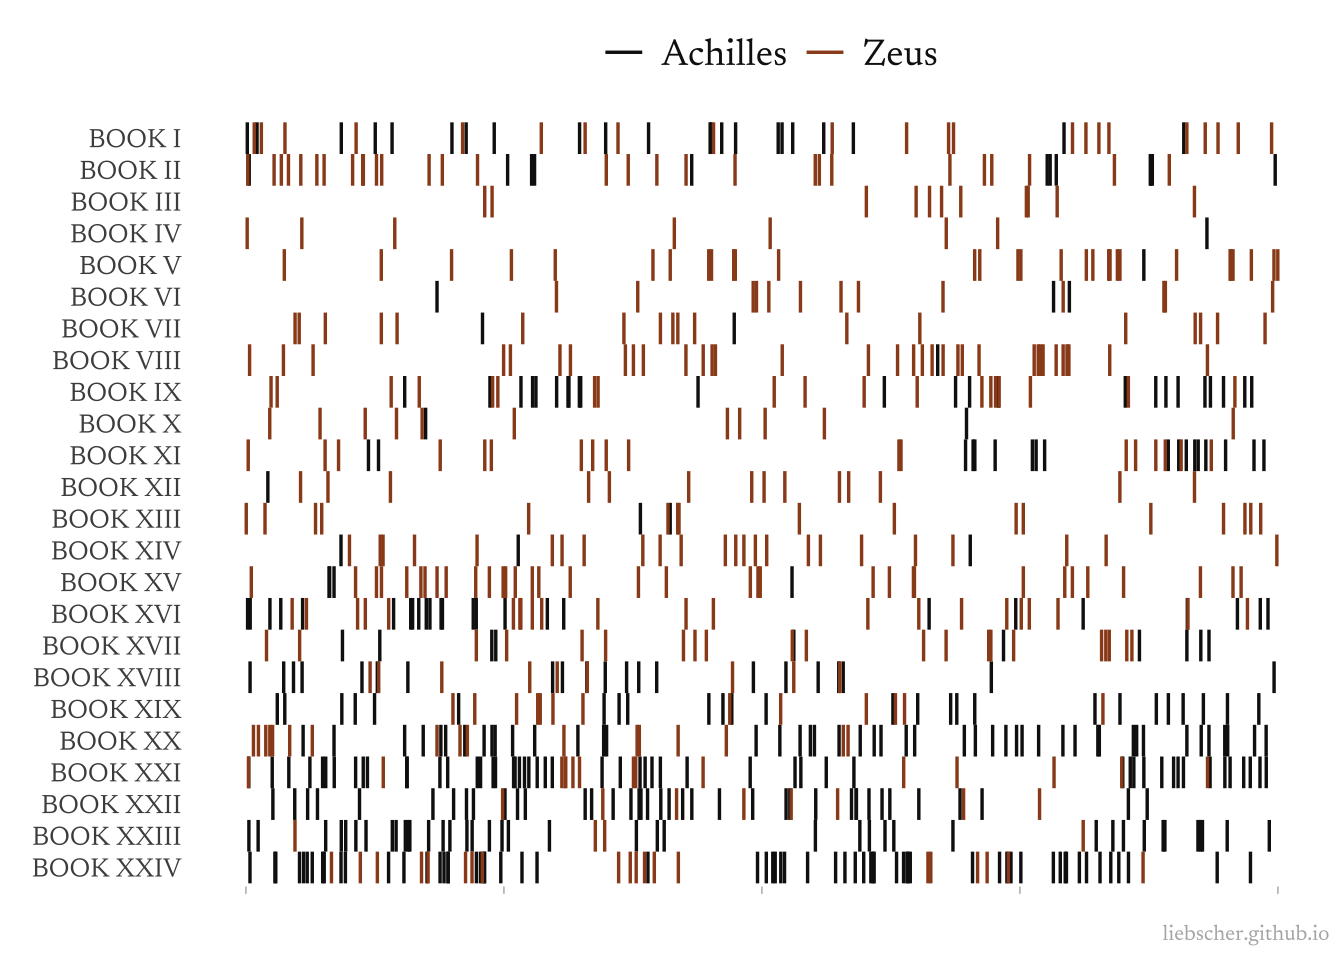
It’s fairly easy to see different points in the plot here. For example, Achilles leaves the battle field (and plot) after his argument with Agamemnon in Book I. When faced with manic Hector and the encroaching Trojan army, Agamemnon sends his warriors to appeal to Achilles in Book IX. I like how you can see Agamemnon’s discussion of Achilles followed by the interactions with Achilles in Book IX.
Another character that interests me is wise old Nestor, portrayed as an elder whose word is final, he offers sage advice to the Greeks. I suspect that Nestor must come in especially at pivotal decision points in the book. He seems the closest to the omniscient gods as the Greeks will get, so perhaps he plays an important plot delivery part.
pull_xray("Nestor", greek_colors[3]) |>
    plot_xray()
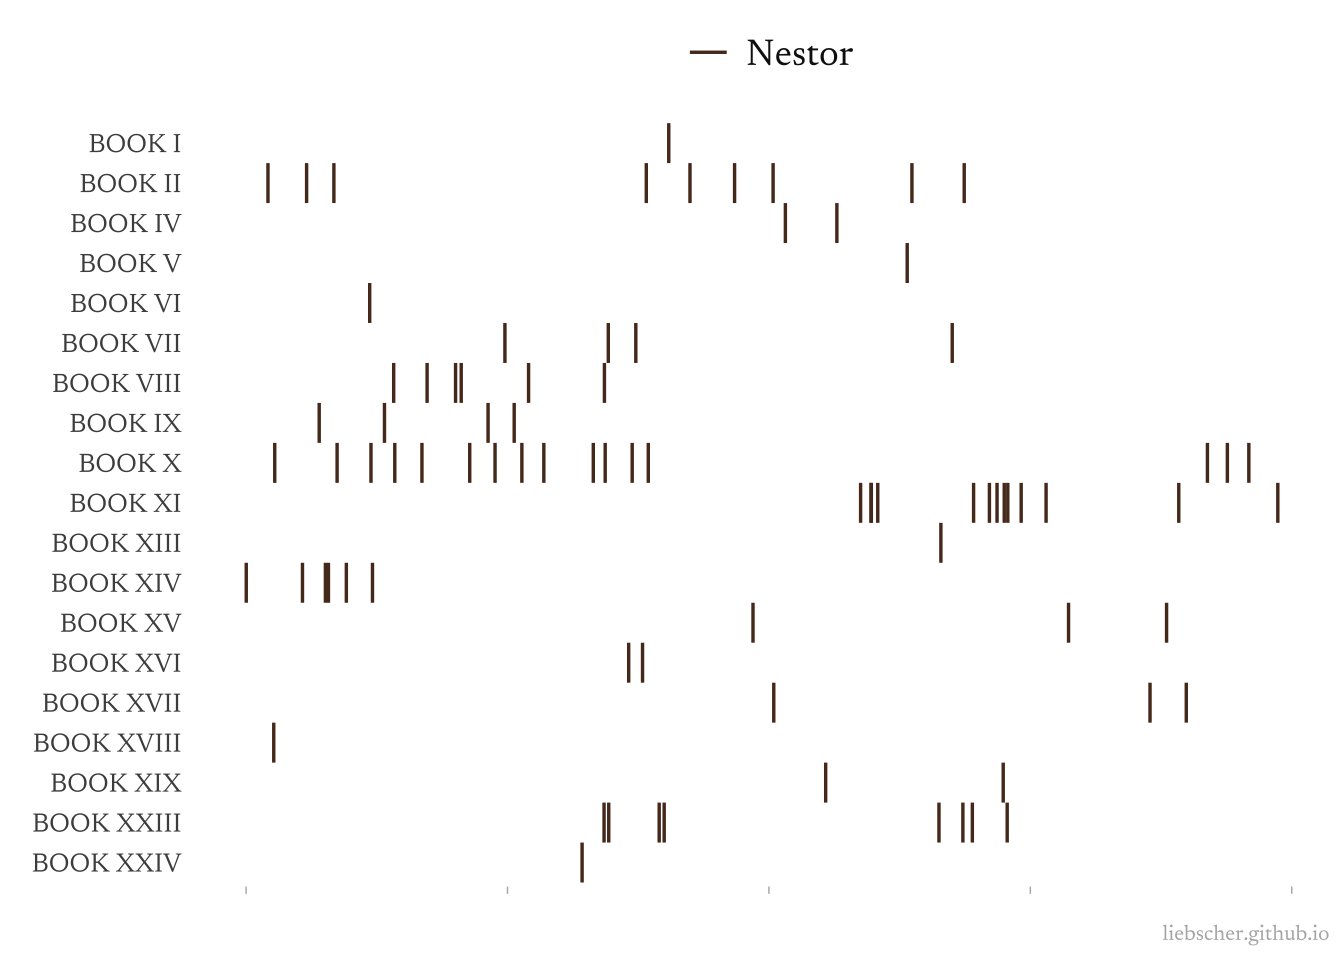
I find this very compelling! For example, after Achilles turns down Agamemnon’s plea to join back in the battle in Book IX, Agamemnon is distressed and in need of guidance. He seeks out Nestor in the middle of the night in Book X. This even feels like a turning point in the novel — Hector and the Trojans are so close to laying siege the ships of the Achaeans and fate is too close for Agamemnon’s comfort. Nestor says to him, in a very prescient way, “Most noble son of Atreus, king of men, Agamemnon, Zeus will not do all for Hector that Hector thinks he will.” Very resolute!
I’m also curious how the Gods appear in the story as well. I would think that Gods who favor different peoples are unlikely to co-appear, just as enemies are unlikely to have conversations with each other. We’ll explore this by looking at mentions of Athene (who favors the Greeks) and Apollo (who favors the Trojans):
bind_rows(
    pull_xray("Athene", greek_colors[1]),
    pull_xray("Apollo", greek_colors[7])
) |>
    plot_xray()
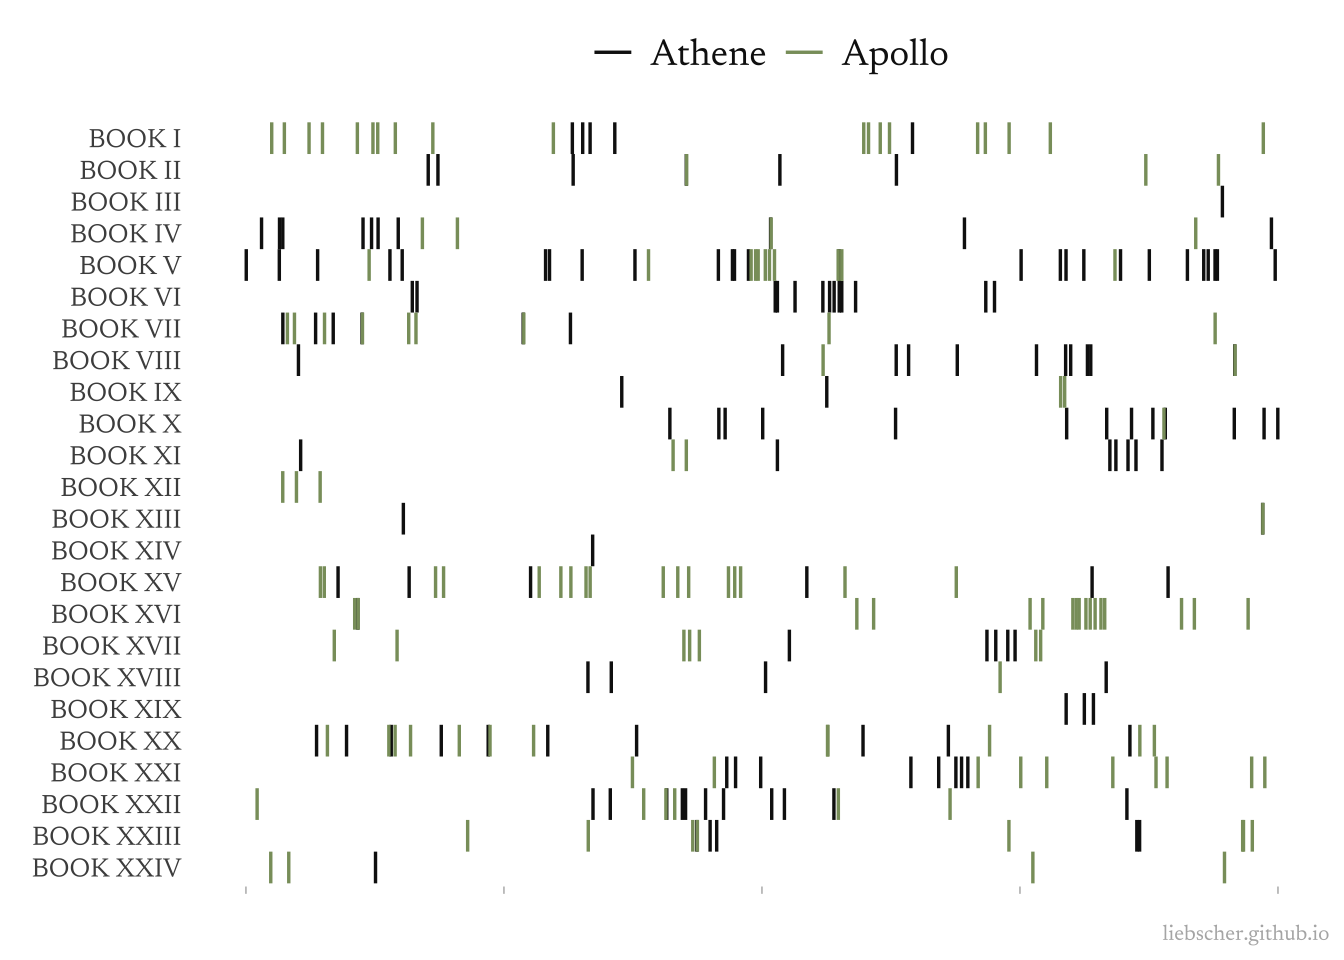
It does appear that Athene, who favors the Greeks, and Apollo, who favors the Trojans, generally don’t overlap very often. Obviously this is just eye-balling, and we’d need to be more specific if we wanted to determine if these gods do interact often.
Being More Artful
I was introduced to Nadieh Bremer’s data art posters for Sony Music a few months ago. I felt inspired by this work, and wanted to mimic it just for fun and to try something new. My childhood and teenage years were very artistic and so some day I might like to come back to this, perhaps merging it with my technical expertise.
Here I’m combining the x-ray plots of our two Achaean heros and the word count of each book. This is hardly a useful plot, but it is interesting to play with the new ggplot2 3.5.0 coord_radial().
p1 <- bind_rows(
    pull_xray("Achilles", greek_colors[3]),
    pull_xray("Agamemnon", greek_colors[3])
) |>
    ggplot(aes(x = (relative + 0.05) / 1.1, y = docname)) +
    coord_radial(inner.radius = 0.1, expand = F, start = 0.2, end = -0.2) +
    geom_segment(
        aes(color = color, xend = after_stat(x), yend = after_stat(y + 0.5), y = stage(docname, after_stat = y - 0.5)),
        linewidth = 1, alpha = 4/5
    ) +
    scale_color_identity() +
    scale_y_discrete(drop = F) +
    labs(x = element_blank(), y = element_blank()) +
    theme_minimal() +
    theme(
        panel.border = element_blank(),
        axis.ticks.y = element_blank(),
        axis.text = element_blank(),
        panel.grid = element_blank(),
        legend.text = element_text(size = 14),
        plot.background = element_rect(fill = "#F2F4F4", color = NA)
    )


p2 <- summary(key_text) |>
    ggplot(aes(Tokens, Text)) +
    coord_radial(start = -0.06*pi, end = 0.06*pi) +
    geom_col(fill = greek_colors[5], width = 2/3) +
    theme_void() +
    theme(
        panel.background = element_rect(fill = "transparent", color = NA),
        plot.background = element_rect(fill = "transparent", color = NA)
    )


p1 + inset_element(p2, 0, 0.495, 1, 1)
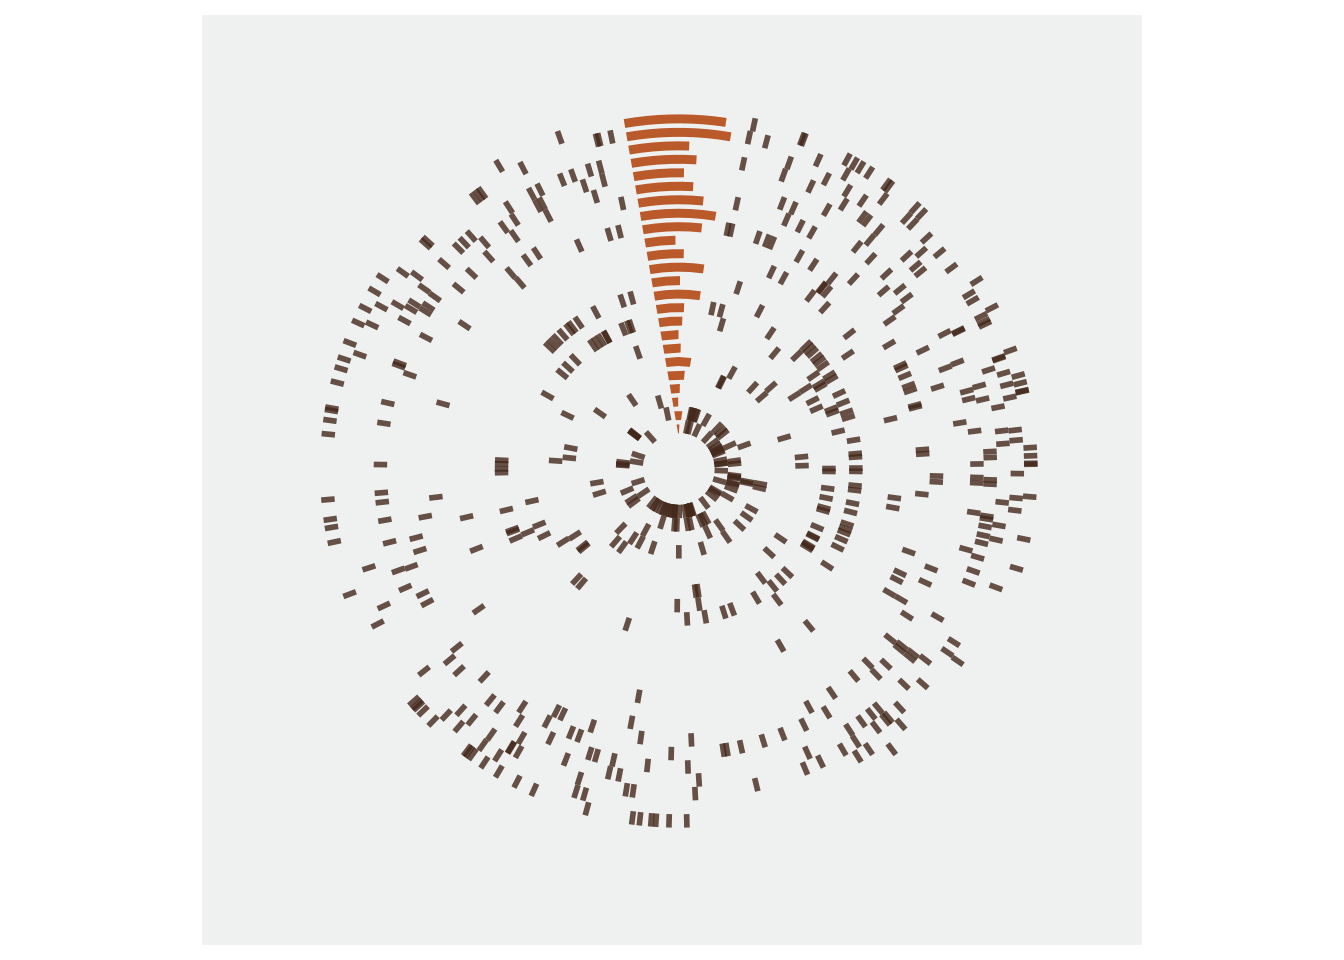
Like I said, maybe not the most useful. But also it could be prettier if I kept experimenting with it. I could continue to layer and layer new data, but I felt like just this much was enough to try some new things. There was a surprising amount of hard-coded-ness to this tangent, unfortunately, which might just be part of what makes this work akin to art.
Love and Death
Although I’m quick to disparage sentiment analyses, I wanted to give it a try with this project. I thought there might be an interesting visualization opportunity with these data too.
For example, “fortune” and “death” have distinct sentiments according to the AFINN (where greater than 0 is positive language and less than 0 is negative language):
tibble(word = c("love", "death")) |>
    left_join(get_sentiments("afinn"))
  word  value
1 love      3
2 death    -2
The question is: how does the sentiment change over time? The goal is to measure sentiment from words like these over the course of each book. We’ll take every word in the book and match it to a sentiment rating. Here we do that and print out the first six words in the book along with their sentiment rating:
tidy_corpus <- tibble(
    doc = as.character(books_ps),
    docnames = str_match_all(text, "BOOK [XIV]+")[[1]][,1]
)

tidy_tokens <- tidy_corpus |>
    unnest_tokens(word, doc, to_lower = T)

sentiment <- tidy_tokens |>
    left_join(get_sentiments("afinn"))

sentiment |>
    head()
  docnames word    value
1 BOOK I   sing       NA
2 BOOK I   o          NA
3 BOOK I   goddess    NA
4 BOOK I   the        NA
5 BOOK I   anger      -3
6 BOOK I   of         NA
We finally compute the cumulative sentiment over each book.
book_labels <- sentiment |>
    distinct(docnames) |>
    mutate(
        docnames = factor(docnames, levels = docnames),

        # for visualization purposes we want just the roman numeral
        book = str_remove(docnames, "BOOK "),
        book = factor(book, levels = book)
    )

sentiment |>
    mutate(docnames = factor(docnames, levels = book_names)) |>
    group_by(docnames) |>
    mutate(
        index = row_number(),
        rel = index / n(),
        cum_sent = cumsum(replace_na(value, 0))
    ) |>
    filter(round(rel * 100) %% 5 == 0) |>

    ggplot(aes(rel, cum_sent + 150, color = cum_sent)) +
    coord_radial(expand = F, inner.radius = 0.25) +
    facet_wrap(~ docnames, ncol = 6) +
    geom_smooth(aes(color = after_stat(y - 200), group = 1), method = "loess", formula = y ~ x, se = F, linewidth = 1.5, show.legend = F) +
    geom_text(aes(label = book), data = book_labels, family = "newsreader", x = 0, y = -155, size = 2.25, color = greek_colors[2]) +
    scale_color_gradient2(low = "red3", mid = "gray90", high = "green4") +
    labs(caption = "liebscher.github.io") +
    theme_void() +
    theme(
        strip.text = element_blank(),
        plot.caption = element_text(family = "newsreader", size = 8, color = "gray70", face = "plain")
    )
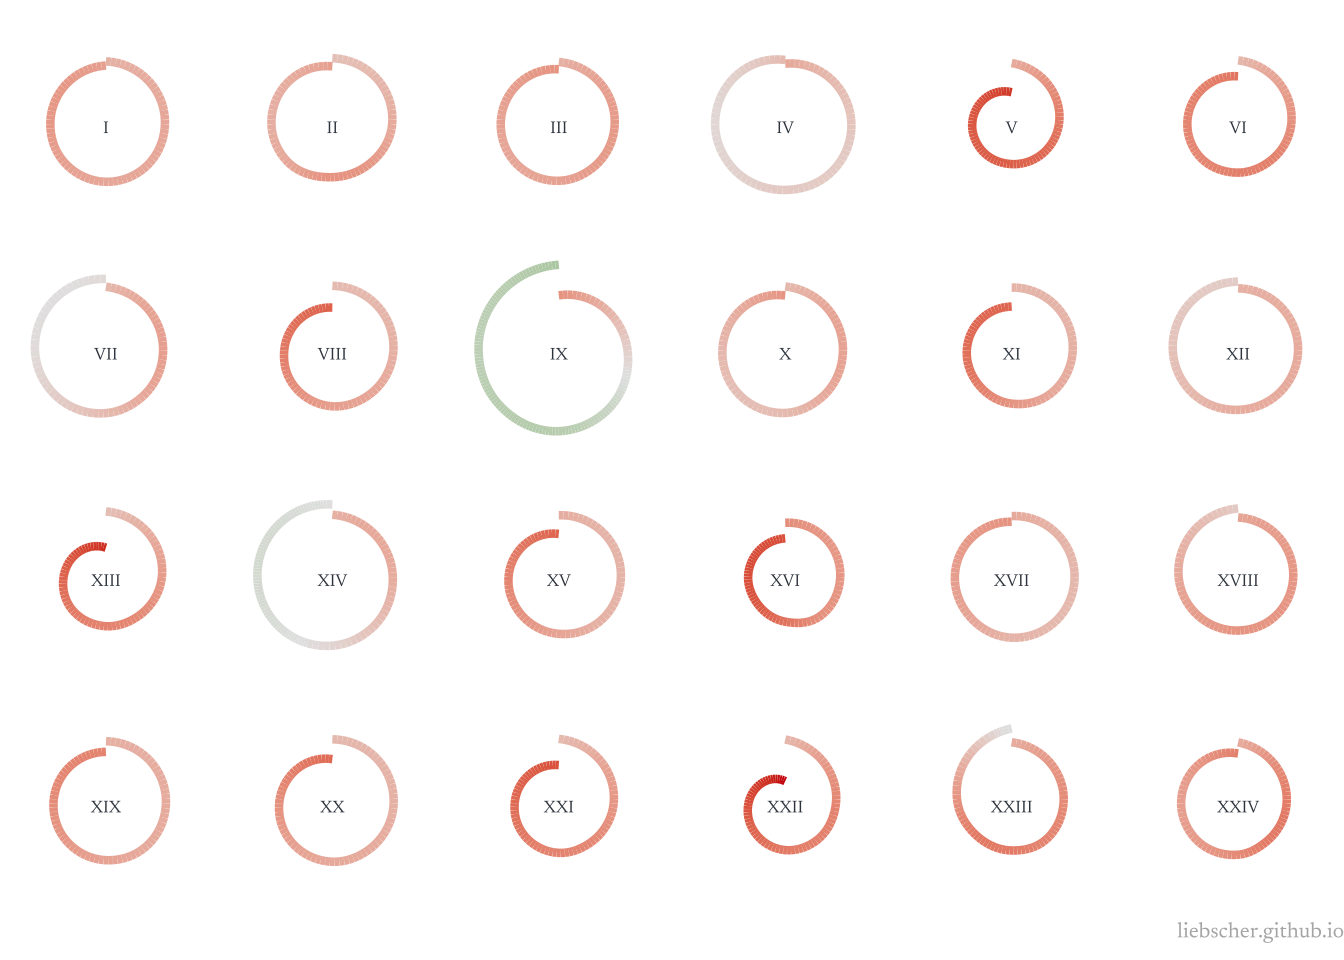
To explain this just a bit:
We have a data frame of every word and its associated AFINN sentiment. Then for each book, we create a cumulative sum of those sentiment ratings. Where AFINN rates 0 as neutral sentiment, and positive and negative sentiment. We scale the books so that we’re visualizing sentiment from the relative beginning to end.
This is on a by-word basis, which is a lot of data to plot on its own. That’s why we sample only every 500th cumulative sentiment measure. We then plot a Loess smoothing curve over these ratings to give us a smooth line from beginning to end. We could do the same thing with the raw data as points, but I think this looks nicer.
As the swirls drift into green, the story has gotten more positive. As they head toward red, it’s more negative.
We can see that most books are rather dark, except Book IX. We probably could expect this, since, after all, it is on the surface a book about war (with lots of slaying and misfortune). It is interesting to see Book XXII particularly dark (this is where Hector is killed).
One shortcoming of this approach is the sheer missingness of sentiments for tokens.
sentiment |>
    summarize(total_words = n(), words_with_rating = sum(!is.na(value)))
  total_words words_with_rating
1      153268              8833
In total, only 8,833 words of the 153,268 have a sentiment rating (barely 5%)! In an ideal world, many more words would have an attached sentiment rating, that way our visuals are more certain. However, sentiment is highly contextual, so it’s unsurprising that this data is so incomplete.
The Web of Characters
I’ll be honest, there’s a lot of characters in The Iliad, and even more names mentioned. At first it was a bit hard to keep track of, but five books in and you definitely start to solidify your understanding of who’s who.
All these characters though have had me dreaming about some sort of “web of characters”. I was partially motivated by similar work, such as Venturini et al. (2017). Unlike this work though, I want to focus solely on characters. I think this is a particularly interesting way to evaluate the story at a high level.
First, we have a few new packages to load for working with graphs:
library(widyr)
library(tidygraph)
library(igraph)
library(ggraph)
library(ggnewscale)
Next, I’m interested in looking at how characters co-occur as a proxy for who’s interacting with who. We might anticipate that certain characters will have interactions with the gods more than other characters, and hopefully we see a distinction between the Gods, the Achaeans, and the Trojans.
We’ll start by splitting the text into paragraphs. This is extremely rudimentary, but it’s a first step which we can later critique. I firmly believe that one step must be taken, no matter how poor, so that we can continuously improve based on concrete evidence.
I’ll count how often characters are mentioned in the same paragraph together. I also split the paragraphs into tokens, and finally calculate the pairwise correlation between tokens within paragraphs.
tidy_paragraphs <- tidy_corpus |>
    unnest_paragraphs(paragraph, doc, to_lower = F) |>
    mutate(paragraph_ix = row_number()) |>
    ungroup()

tidy_paragraph_tokens <- tidy_paragraphs |>
    unnest_tokens(word, paragraph, to_lower = F)

token_cor <- tidy_paragraph_tokens |>
    anti_join(stop_words) |>
    group_by(word) |>
    filter(n() >= 10) |>
    pairwise_cor(word, paragraph_ix, sort = T)

token_cor |>
    head(10)
   item1     item2     correlation
 1 mell      pell            1
 2 pell      mell            1
 3 Argus     slayer          0.925
 4 slayer    Argus           0.925
 5 bowl      mixing          0.728
 6 mixing    bowl            0.728
 7 bearing   aegis           0.703
 8 aegis     bearing         0.703
 9 addressed goodwill        0.616
10 goodwill  addressed       0.616
As we can see, the resulting data frame lists all token pairs and their correlation. The most frequently co-occuring tokens are “pell” and “mell”, which always show up in the same paragraph together. Another pair which stands out to me is “aegis-bearing”. This was new to me when I first read it, and the phrase is typically “aegis-bearing Zeus”, meaning Zeus who carries the aegis shield.
Next, I’ll filter to only pairs of key characters, including gods, Greeks, Trojans, and Women. The Women in The Iliad are worthy of their own entire study (and this has probably already been done), but I separate them because they are quite important to the epic. Helen is the reason why this monstrous war is even happening, and Breseis is the part of the reason Achilles leaves the battle in the beginning.
This doesn’t capture every mention of these characters though. For example, Homer sometimes used “Olympian Thunderer” as an alias for Zeus. That’s okay though, this is just a rough start.
gods <- c("Zeus", "Hera", "Athene", "Poseidon", "Hades", "Apollo", "Artemis",
        "Aphrodite", "Ares", "Hephaestus", "Hermes", "Iris", "Thetis")
greeks <- c("Agamemnon", "Achilles", "Menelaus", "Nestor", "Odysseus", "Ajax",
            "Diomed", "Calchas", "Idomeneus")
trojans <- c("Priam", "Paris", "Hector", "Helenus", "Antenor", "Sarpedon", "Galaucus")
women <- c("Helen", "Briseis")

character_graph <- token_cor |>
    filter(
        item1 %in% c(gods, greeks, trojans, women),
        item2 %in% c(gods, greeks, trojans, women)
    ) |>
    graph_from_data_frame(directed = F) |>
    as_tbl_graph() |>
    activate(nodes) |>
    left_join(
        tidy_paragraph_tokens |>
            count(word),
        by = c("name" = "word")
    ) |>
    mutate(
        group = case_when(
            name %in% gods ~ "God",
            name %in% greeks ~ "Greek",
            name %in% trojans ~ "Trojan",
            name %in% women ~ "Woman"
        )
    ) |>
    activate(edges) |>
    filter(correlation > 0.05)

character_graph |>
    summary()
IGRAPH c9d4c51 UN-- 29 166 --
+ attr: name (v/c), n (v/n), group (v/c), correlation (e/n)
We can refer to the documentation to interpret this summary. It tells us that we have an undirected graph with named nodes, and that it is unweighted and non-bipartite.
Most of the above code should be self-explanatory. The last line though I’m filtering to only retain dyads with a slightly positive correlation (co-occurance). This will keep the edges in our graph to the bare minimum.
Next, we’ll plot this graph:
character_graph |>
    ggraph(layout = "nicely") +
    geom_edge_link(aes(alpha = correlation), color = "gray50", show.legend = F) +
    geom_node_point(aes(size = n, color = group), show.legend = F) +
    scale_size_continuous(range = c(1, 8)) +
    new_scale("size") +
    geom_node_label(
        aes(label = name, color = group, size = n),
        family = "newsreader",
        repel = T, label.size = 0, fill = rgb(1, 1, 1, 0.3),
        show.legend = F
    ) +
    scale_size_continuous(range = c(2.5, 6)) +
    scale_color_manual(values = c(greek_colors[1], greek_colors[3], greek_colors[5], greek_colors[7])) +
    labs(color = element_blank(), caption = "liebscher.github.io") +
    theme(
        panel.background = element_rect(fill = "white", color = NA),
        plot.caption = element_text(family = "newsreader", size = 8, color = "gray70", face = "plain")
    )
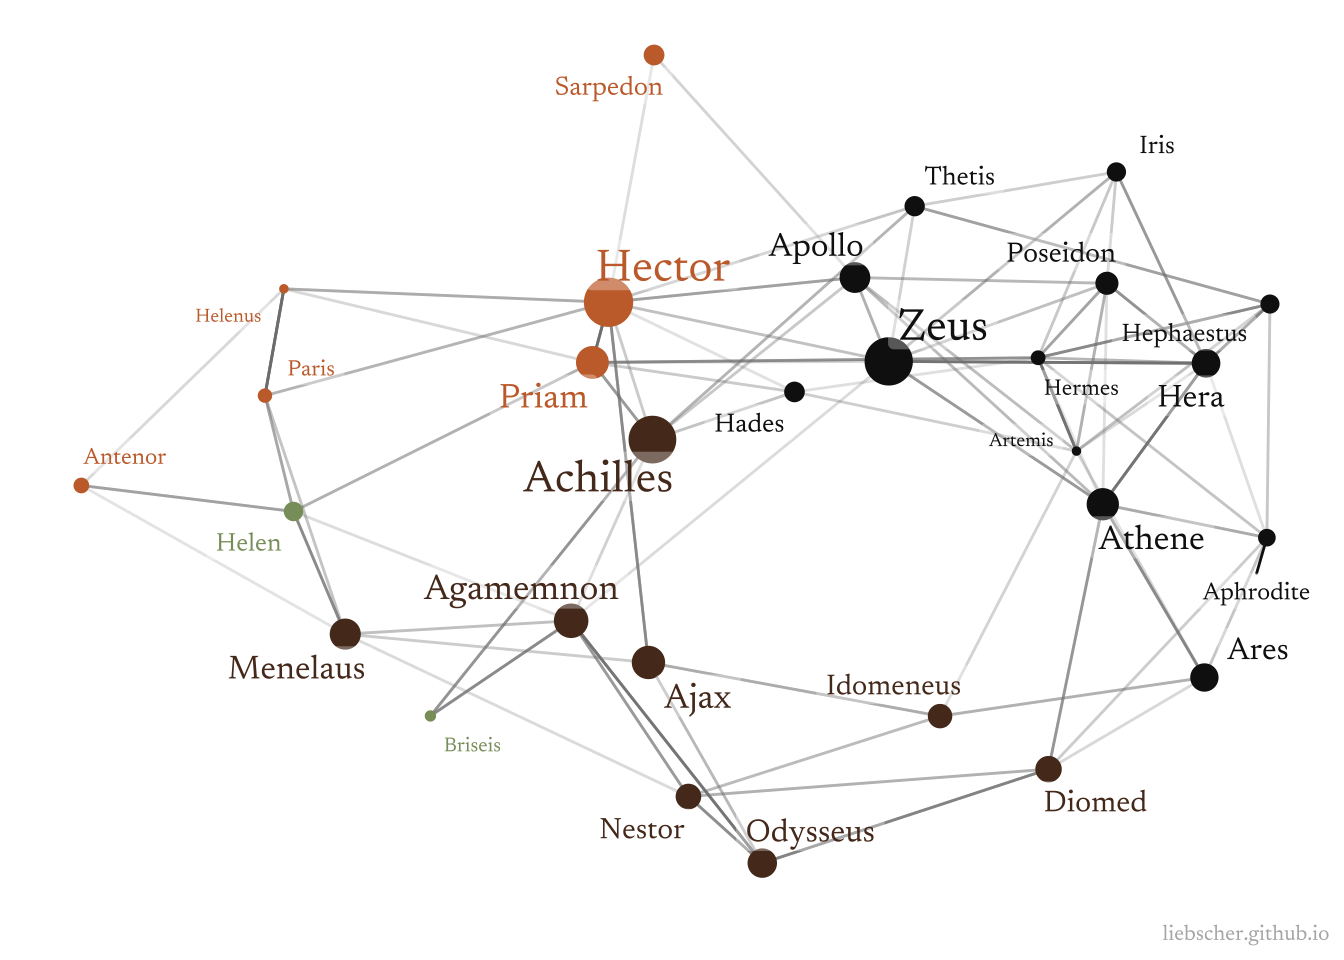
Spectacular!
We can see some interesting patterns arise. For example, Helen connects Paris and Menelaus (she was originally Menelaus’s wife, but Paris of Troy abducted her, thus initiating the war). We can also see Diomed linked to Athene (who seems to favor him), Iris sending messages between gods, and the overall three separate camps of people.
I’m pleased that this graph closely resembles more rigorous network analyses of the book (see e.g. Kydros et al (2015)). Some shortcomings of our approaches are the rather 1-dimensional perspective that characters are nodes, and edges are simple interactions. It would be nice to be a bit more inclusive with these definitions.
Who’s your patriarch?
In The Iliad, often times men are mentioned by their father’s name, which appears to be an honorific.
I’m curious which fathers are mentioned the most relative to how often their sons are mentioned. First, we’ll join all the text into a single string so that it’s easier to search for substring across all books:
flat_text <- tidy_corpus |>
    pull(doc) |>
    str_flatten(collapse = " ")
Then we’ll define a regular expression to search for mentions of patriarchs. This often is written like “son of Atreus” but could also be “Sons of aegis-bearing Zeus”. In both cases, we’d want to capture “Atreus” and “Zeus” respectively.
fathers <- flat_text |>
    str_match_all("[Ss]ons? of[\\- A-Za-z]*? (?:King )?(?<name>[A-Z][a-z]+)") |>
    magrittr::extract2(1) |>
    as_tibble() |>
    filter(!(name %in% c("Achaeans", "Troy", "Trojans")))
Great, how many unique fathers are mentioned?
n_distinct(fathers$name)
162
Which fathers are most often mentioned?
fathers |>
    count(name, sort = T) |>
    head()
  name        n
1 Atreus    133
2 Peleus     99
3 Tydeus     84
4 Cronus     73
5 Priam      48
6 Telamon    45
Next we’ll map each son to his father, and count mentions of the son’s name. We’ll work with just a subset of characters here to keep the analysis interpretable.
patrilineality <- tribble(
    ~father, ~son, ~people,
    "Cronus", "Zeus", "Gods",
    "Cronus", "Hades", "Gods",
    "Cronus", "Poseidon", "Gods",
    "Zeus", "Apollo", "Gods",
    "Zeus", "Ares", "Gods",
    "Priam", "Hector", "Trojans",
    "Priam", "Paris", "Trojans",
    "Priam", "Helenus", "Trojans",
    "Atreus", "Agamemnon", "Achaeans",
    "Atreus", "Menelaus", "Achaeans",
    "Peleus", "Achilles", "Achaeans",
    "Laertes", "Odysseus", "Achaeans",
    "Neleus", "Nestor", "Achaeans",
    "Laomedon", "Priam", "Trojans",
    "Telamon", "Ajax", "Achaeans",
    "Oileus", "Ajax", "Achaeans",
    "Tydeus", "Diomed", "Achaeans",
    "Menoetius", "Patroclus", "Achaeans"
)
Finally, I’ll count how often each son is mentioned in the text, and join that with the data frame of how often his father is mentioned.
patrilineality_mentions <- patrilineality |>
    rowwise() |>
    mutate(son_mentions = str_count(flat_text, son)) |>
    group_by(father) |>
    summarize(
        sons = paste0(son, collapse = ", "),
        sons_mentions = sum(son_mentions),
        people = first(people)
    ) |>
    left_join(
        fathers |>
            count(name, name = "father_mentions", sort = T),
        by = c("father" = "name")
    ) |>
    ungroup()

patrilineality_mentions |>
    head()
  father    sons                  sons_mentions people   father_mentions
1 Atreus    Agamemnon, Menelaus             342 Achaeans             133
2 Cronus    Zeus, Hades, Poseidon           580 Gods                  73
3 Laertes   Odysseus                        124 Achaeans               9
4 Laomedon  Priam                           184 Trojans                3
5 Menoetius Patroclus                       173 Achaeans              27
6 Neleus    Nestor                           93 Achaeans              10
This looks good. Let’s assume that the more a father is mentioned compared to his son, the more important that father is. Let’s plot this importance measure as the ratio of father mentions to son mentions:
patrilineality_mentions |>
    mutate(
        pair = paste0(father, " > ", sons),
        father_importance = father_mentions / sons_mentions
    ) |>
    ggplot(aes(father_importance, fct_reorder(pair, father_importance))) +
    coord_cartesian(xlim = c(0, 1)) +
    geom_segment(aes(x = 0, xend = father_importance), color = "gray90") +
    geom_point(aes(shape = people)) +
    scale_x_continuous(breaks = c(0.1, 0.9), labels = c("Very Unimportant", "Very Important")) +
    labs(y = element_blank(), x = element_blank(),
        shape = element_blank(),
        title = "Homer's Patriarchy",
        caption = "liebscher.github.io") +
    theme_iliad +
    theme(legend.position = "top", legend.text = element_text(size = 10))
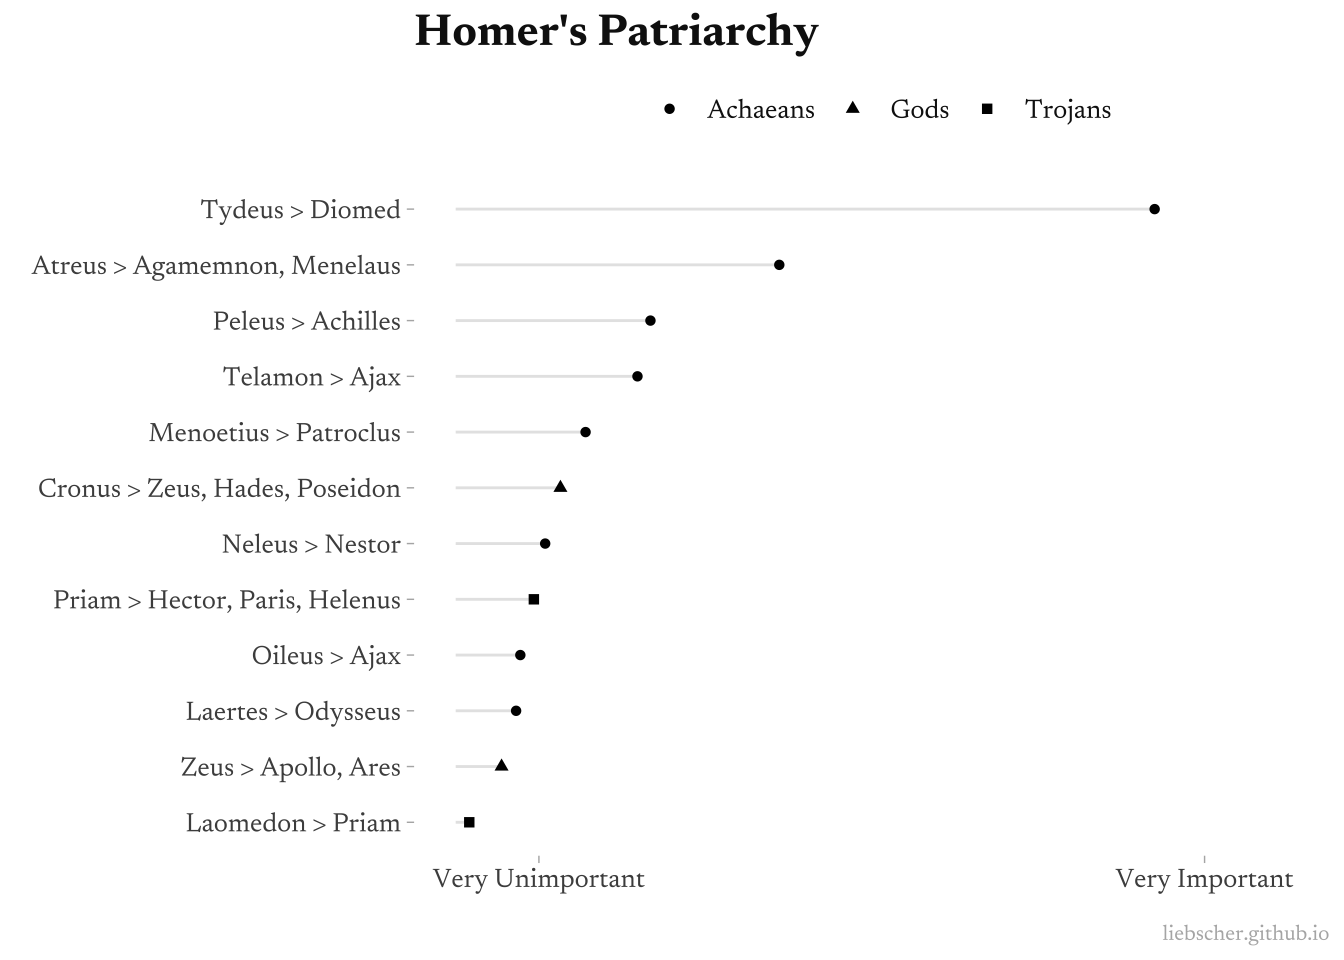
Tydeus comes out as a very important patriarch, as the story is told. Atreus as well. At first I was surprised to see Zeus so low in importance, although I think we can explain this as a difference between Zeus as the patriarch and Zeus as the subject. Essentially, his name is being double counted as a patriarch when some of those mentions are him as an individual. We could say the same of Priam.
Conclusion
The Iliad is a must-read. It is one of the foundational layers of Western civilization: whether we realize it not, contemporary thought reflects authors like Goethe (Wohlleben, 1967) and Socrates (Brickhouse & Smith, 2000), who reflect Homer. Reading The Iliad has not been nearly as difficult or monotonous as I expected. On the contrary, it’s engaging, accessible, and colorful. The characters are rich, emotive, and complex. There may be many of them (nearly 100), but Homer’s storytelling is crisp and we don’t get too lost in the web. I would love to dive deeper in a more literary analysis of leadership and values as expressed by the characters. For example, I really enjoy such lessons as, “he that foments civil discord is a clanless, hearthless outlaw.”
There’s too many ways to dive computationally into a story like this, so this is just a start. In fact, I’d estimate that The Iliad is one of the most analyzed stories ever. I’m happy to be able to contribute one piece more to this timeless endeavor. I’d like to explore more of the extant analyses on the subject, although even that feels like a big task.
I have a copy of The Odyssey which I bought at the same time, and I’d like to read that next. I will consider writing a follow-up post on any analyses I do for that story.