Another article lamenting the Replication Crisis within the social sciences would be redundant and unnecessary. For those who are unfamiliar though: the replication crisis is a recent phenomenon in the social sciences, especially psychology, where a large number of scientific research articles aren’t able to have their results found again by independent research teams. This can be because of how the research was conducted (e.g. due to their methods), but also some researcher have been found to have fabricated their data in order to produce favorable results.
Currently, I don’t have the focus to plan out and rerun in full any particular research article. But there’s a number of other ways we can validate or test published research. This is especially, or only, true if that article has made their data publicly accessible. For example, we can use the data they’ve collected and published to try to reproduce the results they report. Or, we could apply different methods for analyzing that data to see if the results hold up.
In this article I’m doing both of these with a paper I recently found that ran a survey to assess the relationship between being outdoors and mental well-being. The authors published their data, and the article is open access. We’re going to download their data, try to reproduce their results, and compare those results to alternative methods.
Article: A room with a green view

The article we’re looking at is titled “A room with a green view: the importance of nearby nature for mental health during the COVID-19 pandemic” (2021) by Masashi Soga, Maldwyn Evans, Kazuaki Tsuchiya, and Yuya Fukano. It was submitted to the journal Ecological Applications (IF: 6.1) in fall 2020, and published in March 2021.
The authors report on a survey they conducted in June 2020 of a sample of 3,000 people in Tokyo, assessing their mental well-being, their access and exposure to the natural world, and a set of lifestyle behaviors.
The authors claim that their results demonstrate that the experiences of nearby nature, including just viewing nature out their windows at home, can help prevent poor mental helath during stressful time periods. They explain the positive relationships they found in three ways: direct multi-sensory interactions with nature improve mental health; greenspace use may encourage physical activity, which in turn improves mental health; and greenspace use promotes interaction with one’s community, which in turn improves mental health.
The article is of some value to researchers in ecology, but I think it is of greater value for policymakers and those in the psychological sciences as additional evidence that greenspaces are a meaningful and straightforward intervention to improve mental well-being.
Replication of published results
I wasn’t able to find any analysis code published by the authors, which has revealed a couple ambiguities in their paper. Nonetheless, I was mostly able to reproduce the results that they reported with the data they made available.
First off, I was able to successfully reproduce all of their descriptive statistics of the data. This importantly included the proportion of greenspace use frequencies and ability to view nature out people’s windows. For example, the average respondant spent an hour in greenspaces per week in the month leading up to the survey. 81% said they had a view of nature from a room in their house they spent much of their time. The authors claimed there was a correlation of \(r=0.69\) between greenspace use frequency and duration, which I was also able to replicate.
I was only somewhat able to replicate their primary findings between their five measures of mental well-being and their measures of greenspace use and nature view. Some snags I ran into included:
- Why they used corrected AIC, when they have only a fraction of the number of parameters compared to number of observations. Although corrected AIC is well-known, it seems to me like they just used the defaults of the modeling package they used.
- How did they come up with a delta of 6 for corrected AIC as their model inclusion criterium?
Despite the things I took for granted, our main figures look very similar, as do our tables of results.
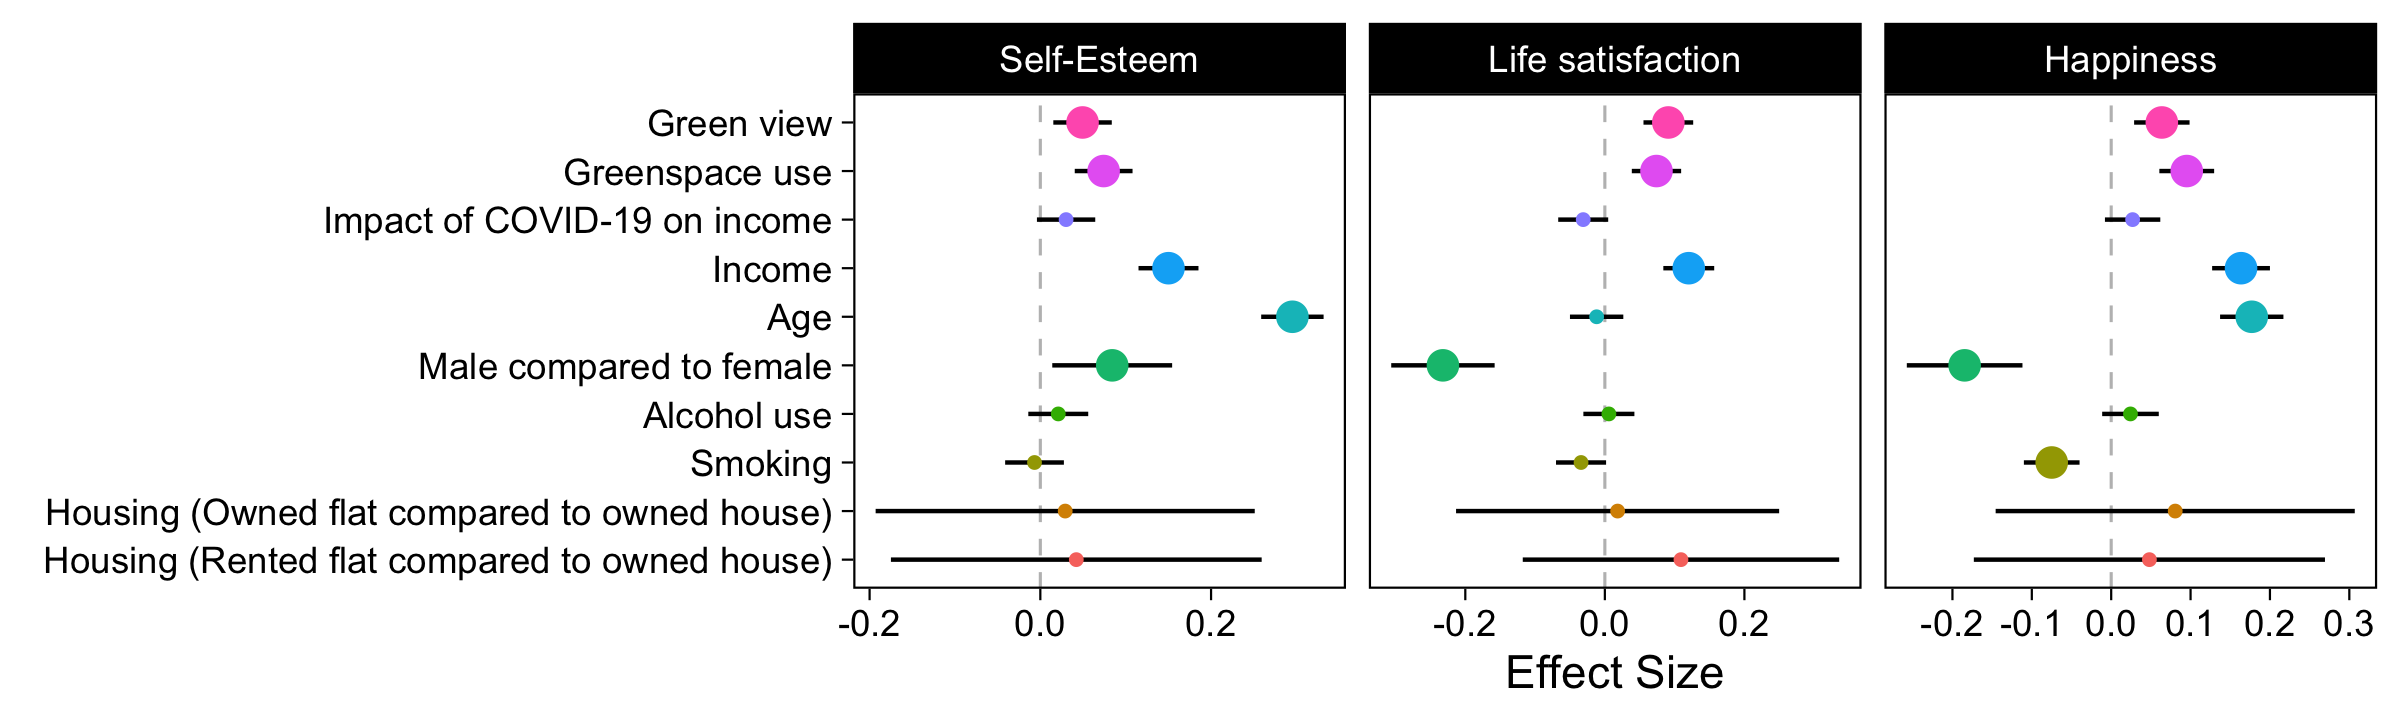
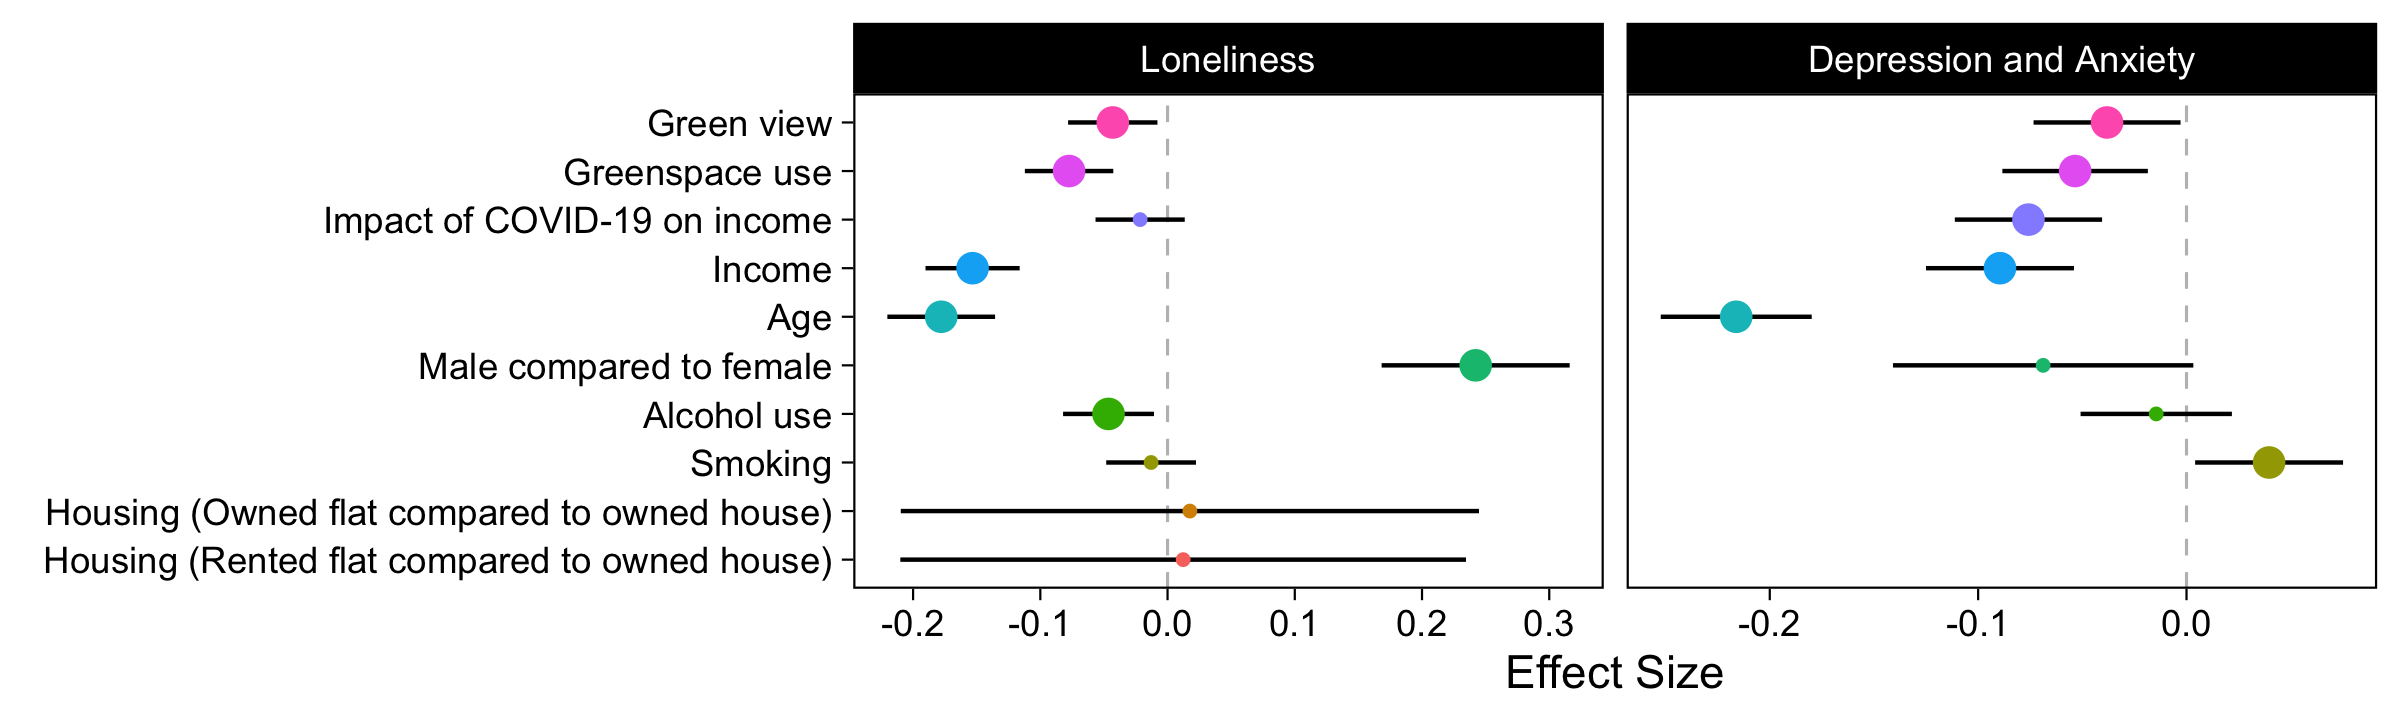
Of note, I did not include the NVDI data which they said they included because I do not have the software. This could be the reason why our results differ. It’s unclear why they didn’t include this variable in their shared data CSV.
Our results differ in these notable ways: the authors’ coefficients for Green View seem larger than mine, some of the magnitudes of my coefficients for Green View and Greenspace View do not align with the authors’, and the authors’ CIs for Housing Type factor levels seem tighter than mine.
Multiverse
While I was on BetterUp’s Summer Break, I read a lot. One thing I read into was multiverse analysis. This is a concept thought up independently by multiple research groups. Its goal is to reduce the arbitrariness in statistical modeling by accounting for a variety of operationalizations in your model setup. This helps prevent “edge of the knife” results (regarding the fragility of one’s results/conclusions).
Processing Choices
One of the first steps in a multiverse analysis is to assess the possible forking paths of decisions a researcher might make when doing their analysis. Once these paths are identified, we can descirbe them such that we can essentially evaluate each path. Having results for all possible permutations of the data slicing and dicing leaves us with a more robust way to view the results in the face of researcher decisions.
While it’s arguable that their analysis is more robust because they computed a model average, this model average can only account for arbitrary inclusion or exclusion of predictors. A multiverse on the other hand, can include decisions about variable transformation (IV and DV), outlier exclusion, and nonlinear transformations (e.g. interactions).
Here are some of the processing choices I came up with:
-
Colinearity of nature predictors
- CN1: Use only Greenspace Use Frequency
- CN2: Use both Greenspace Use Frequency and Nature View
-
Greenspace use log-transformed
- GSL1: Identity
- GSL2: Greenspace Use Frequency log-transformed
-
Exclusion of “Other” Housing Types
- EXHT1: No exclusion
- EXHT2: Exclude respondents with Housing Type of “Other”
-
Including only full-time workers
- FTW1: Everyone
- FTW2: Only individuals who work 5 or more days per week
-
Presence of demographic predictors
- DP1: Not present
- DP2: Include age and sex
-
Assessment of Age
- AB1: Age z-scored
- AB2: Age commonly binned
-
Presence of income predictors
- IP1: Not present
- IP2: Include income and impact of COVID-19 on income
-
Income log-transformed
- ILP1: Identity
- ILP2: Income is log-transformed
-
Presence of lifestyle predictors
- LP1: Not present
- LP2: Include number of children, number of working days per week, presence of a pet, alchol drinking frequency, smoking frequency, and housing type
This is equivalent to \(2^9\) combinations or branches of analysis logic.
I used the multiverse package to accomplish the branching logic and looping necessary to traverse all these combinations. This package actually seemed to work great. I was daunted when I started this that I’d have to write all the logic myself, but the package fits seemlessly with dplyr and they make it really easy to define all the different decisions. It took a little adjusting my code to fit the paradigm, but it was worth the startup cost.
Results
Multiverse analyses aren’t the kind of analysis where you get a single number back and try to make a decision based off that. Instead, you rely on visual inspection (usually of plots, but if you’re into it tables work too) and human pattern recognition to measure your trust in the hypotheses.
For example, in the original analyses, the authors write in their results:
Both greenspace use and green view were significantly positively associated with an increase in self-esteem, life satisfaction, and happiness and negatively associated with loneliness and depression and anxiety
Although they don’t include p-values here, this result has five p-values sitting write behind it (for the five DVs). Instead of making a judgement based off just a single p-value, we can plot the p-values for all of our branching decisions. In this case, we have our five DVs, and for each the p-value of the average marginal effect of Greenspace Use:

This looks very promising! Notice how all of our analyses have a p-value on this marginal effect of less than 0.05. Now, 0.05 is also an arbitrary decision, but we can see here that most of our results are even less than a p-value of 0.01. This tells us that basically no matter how we operationalize the problem, according to our processing decisions above, we routinely believe that we can reject the null that there is no effect of the average marginal effect of Greenspace Use on each of our five mental health signals.
In laymans terms, Greenspace Use seems to have a strong relationship with mental health no matter how we set up those models.
Another way to visualize a multiverse analysis is a specification curve (Simonsohn et al 2019). Here we again have our five DVs of interest, and for each, our average marginal effect sorted in ascending order, and colored whether it obtained significance.

We see that virtually any arbitrary analytical decision renders the effect significant, providing massive support for rejecting the original null.
Wrap Up
With the data the authors provided, and the rough analytical framework they provided, we have strong evidence that the effect they identified exists. We’ve come to this conclusion through a multiverse analysis which showed that among many arbitrary analytical decisions, we consistently were able to reject the null that there was no effect of Greenspace Use on our mental health.
Now, this might look good on paper but there are a few caveats. First, we were unable to include the NVDI data that the authors included. This seems like a substantial lack, and could easily make the story more complex. Second, we are not making any new decisions about estimand: meaning, the effect of interest is the same as in the original paper. We aren’t looking a new DVs, or new ways of measuring Greenspace Use. Third, we’ve tested only linear regression models. While we could investigate other model structures, we don’t in order to save time.
We also haven’t discussed effect size. Just because we found a bunch of significant results, doesn’t mean the effect we see has any real world meaning. By my judgement, an average marginal effect of less than 1 in this case indicates the effect is rather small. Not negligible, but not transformation. On the other hand though, we’re measuring differences in mental health, which are subject to an infinitude of influences, so even a small impact can be meaningful.
We also have left all the theoretical implications to the authors, which I am somewhat underwhelmed by. For example, the authors question why Greenspace Use might have this impact on mental health. They posit three answers:
There are several possible pathways through which greenspace use promotes mental health outcomes. The first, and most direct one, is the added health benefits of direct interactions with nature. … Second, greenspace use is likely to encourage people to undertake physical exercise (so-called “green exercise”), which in turn contributes to improving mental health. Third, urban greenspace provides opportunities to interact with other members of local communities (e.g., friends), which is likely to ameliorate loneliness and improve well-being.
The authors suggest that longitudinal studies be conducted in order to tease out causality.
Lessons
All code and data available at https://github.com/liebscher/replication-a-room-with-a-green-view.
Here are a couple lessons I learned while doing this project:
- Open Science is a good thing. I cannot think of one reason it could be bad. More researchers need to publish all of their data, and code too. Github is indispensable, but there are other platforms available too.
- After getting all my results, I wanted to put my work on Github. In the process, I accidentally deleted all my code. This is a reminder to start your repository before you begin coding, and to commit your progress consistently. I was a little bummed to have done this, but life moves on and I think my second version was better.
- I ended up thinking of more analytical branches as I went. This doesn’t seem like the “best” way to go about constructing the set of branches
- Multiverse analyses can be valuable if you feel confident in your estimand, your data collection, and your theory. If those aren’t settled though, you’re just dressing up a fundamentally wrong argument.